How to connect Power BI to MonitorPro
Introduction
Power BI is a Business Intelligence (BI) tool that allows users to visualise their data. As with many BI tools there is a need to connect to an external data source(s) to achieve this. Data held within MonitorPro can be accessed by Power BI and dashboards and other output created with data stored within. To do this a connection to the underlying MonitorPro database is required. This document is a basic guide to assist MonitorPro users and administrators to connect to MonitorPro using Power BI. It gives some examples of data presentation but is not a guide on the use of Power BI or is designed to replace any Power BI manuals or documentation.
This guide was created using Power BI Desktop Version: 2.107.683.0 64-bit (July 2022) Windows and connecting directly to the MonitorPro database running on Microsoft SQL Server 2017.
Database Connection
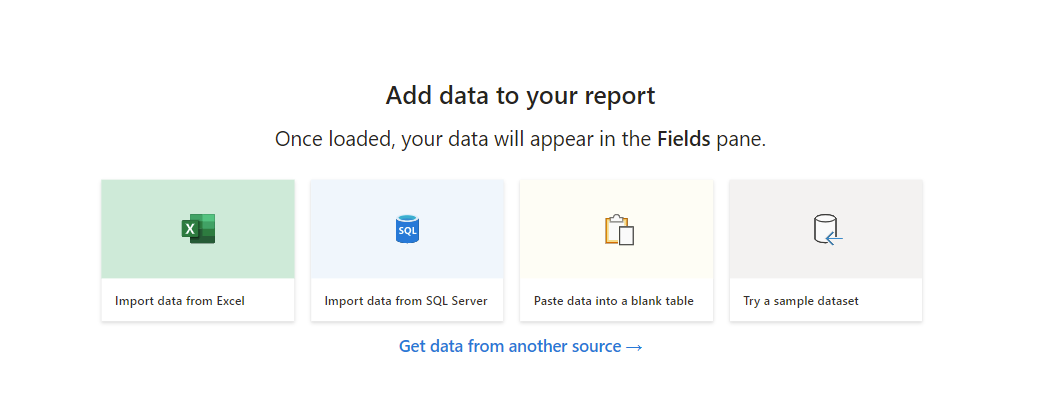
Choose to import data from SQL Server
Caution
If the visuals you create are to be published then you need to ensure the connections you make are accessible or a suitable gateway is established. This is outside of the scope of this guide and it's assumed that the database being used for the connection is accessible, and the appropriate firewall exceptions are made to facilitate.
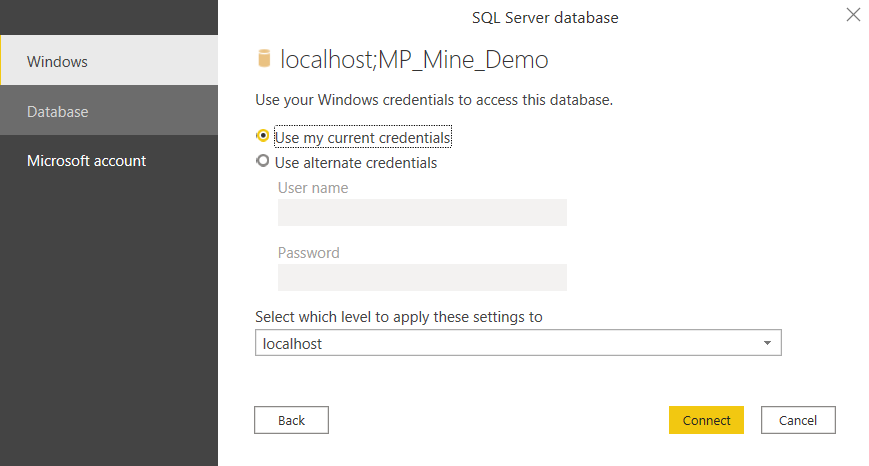
To authenticate you will need either a valid Windows Account or SQL username and password with access to the database(s) in question.
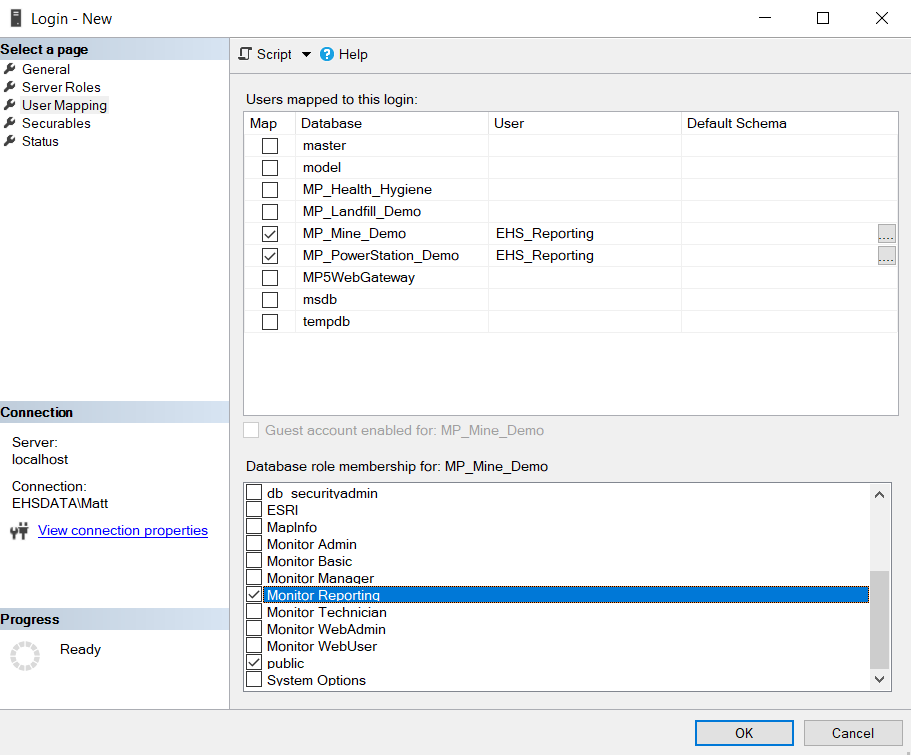
Users can be created for this purpose or existing credentials with access to MonitorPro can be used. If a dedicated account is to be used, then the ‘Monitor Reporting’ role should be allocated. This role has limited access to particular tables and functions specifically used for outbound reporting and can’t access other system tables not typically required.
Connection using Stored Procedures
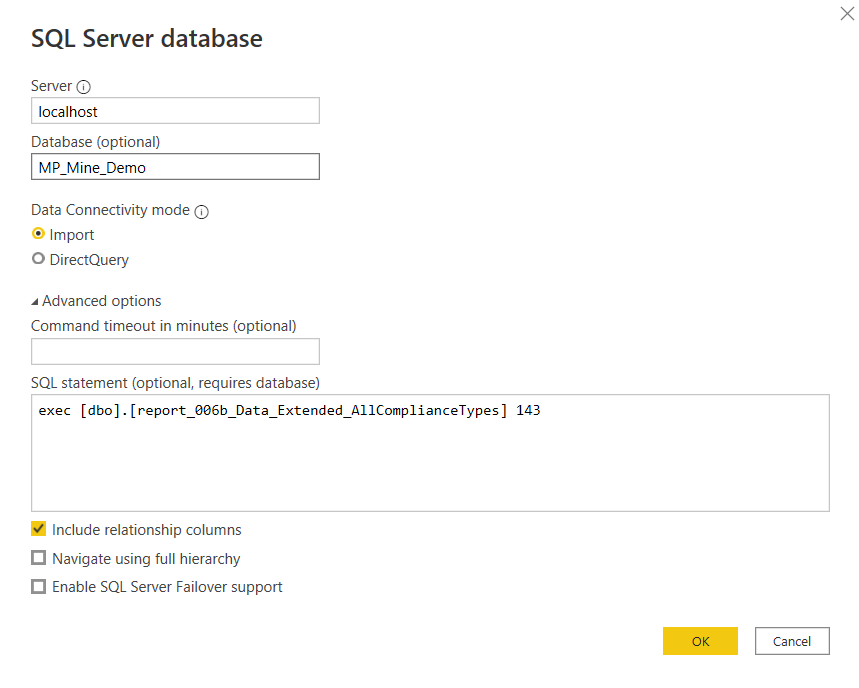
Add the server details and optionally the database name. Choose the Import option in the Data Connectivity Mode.
Expand the Advanced options and include the SQL statement to execute the required MonitorPro Report Stored Procedure and the required lSelectionID. The details of how to obtain these are detailed further below in the Data selection and lSelectionID sections.
Note
From our testing it is not possible to run a Stored Procedure using the DirectQuery mode and has to be done via the direct Import. Refreshing and Scheduled Refreshing can be facilitated in Power BI, or users can opt to use DirectQuery using the SQL View method detailed below.
Click OK and a summary will be displayed of the data being returned. Then click Load. These will be saved as Query 1, 2 etc., but can be renamed by clicking on the menu to the right of the name and editing using the Edit query option.
As detailed below there is no need when connections are made in this mode to further refine the data using the lSelectionID, as its already applied within the query. To refine the data being returned in Power BI the Dataset referenced can be modified in MonitorPro to facilitate. Power BI will need to be refreshed to apply these changes made in MonitorPro. Multiple connections can be made referencing a number of lSelectionID's as required to build the Power BI visuals.
Connection using SQL Views
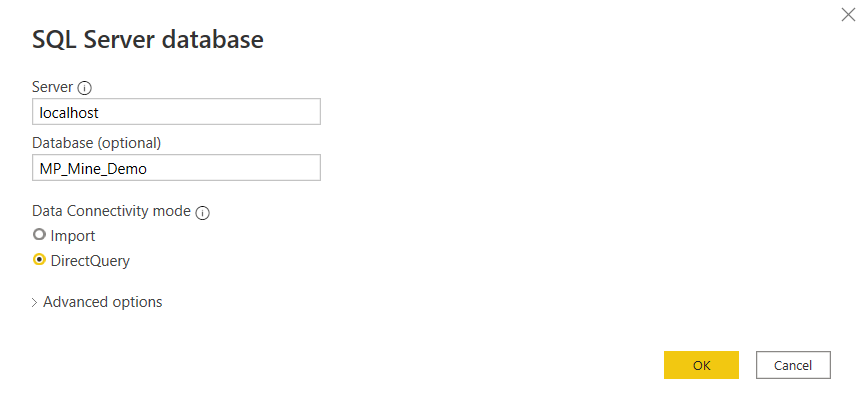
Add the server details and optionally the database name. A direct query will enable the data to be dynamically refreshed with that added to MonitorPro.
Data selection
For reporting, we recommend the use of the report_ stored procedures. These Stored Procedures have been specifically designed to output data in a number of formats useful for onward reporting. They contain all the basic fields required such as Location, Sample Point, Variable/Parameter, Data Source, Date/Time etc. They are named in such a way as to give a good indication of the fields included; however you can connect and preview the data to confirm they contain the fields you require. If you are unsure or believe you need custom fields not contained in these Stored Procedures, please contact support@ehsdata.com.
You can connect to tables in the database directly but as the database is relational and the data normalised, without comprehensive knowledge of the database schema, even basic table linking could be onerous. There is a limited need to do this when using the Stored Procedures, as the work has been done for you. The only direct table linking required is in obtaining a lSelectionID as detailed in the section below (if you don’t at this stage know your required lSelectionID, it's worth reading the below section first before proceeding).
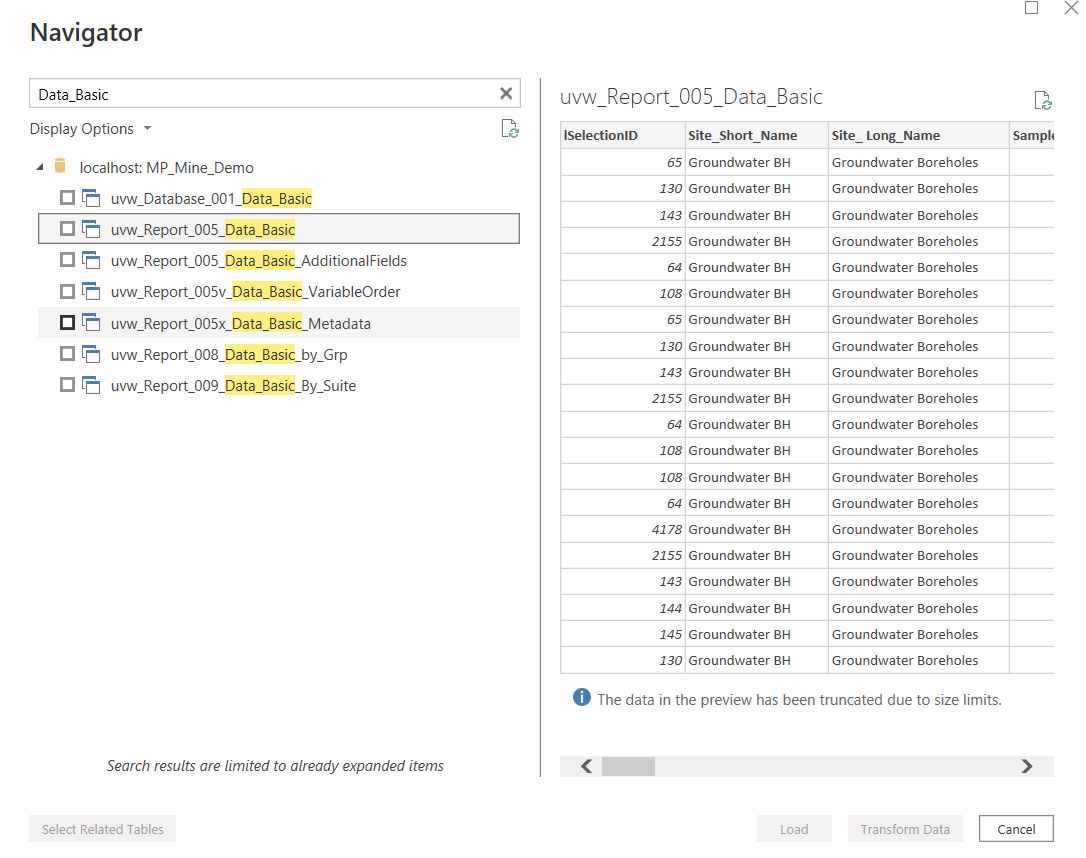
It's recommended users start with using report_005_Data_Basic. For ease, these Stored Procedures are duplicated as SQL Views. In the Navigator filter to the required SQL View. Selecting it should give a preview of the output.
Then click Load.
Filtering
Unlike with the direct connection to a Stored Procedure, the SQL View is providing the entire contents of the MonitorPro database at this stage and needs filtering to be manageable in creating visuals.
Drag the lSelectionID field into the page filters and set this to filter only on the lSelectionID (Dataset) of interest.
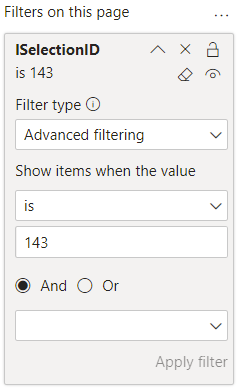
To refine the data being returned in Power BI the Dataset referenced can be modified in MonitorPro to facilitate. Power BI will need to be refreshed to apply these changes made in MonitorPro. Additional filters on other objects can also be applied in Power BI depending on the required visuals.
lSelectionID
To obtain an lSelectionID for the required data it can be useful to connect to tblSelection directly.
You can directly locate the required lSelectionID, by using the sSelectionstorename (the common name shown to the user in MonitorPro) as a filter in your query.
lSelectionIDs will not change and the data presented in Power BI will continue to represent that data contained within the Dataset. Datasets used for this purpose should contain dynamic date ranges or broad date ranges to retain current data. They should be broad enough to allow for further refinement, but not too large to impact long-term performance. Additional Datasets can be made and added for use in Power BI at any point.
Data Analysis
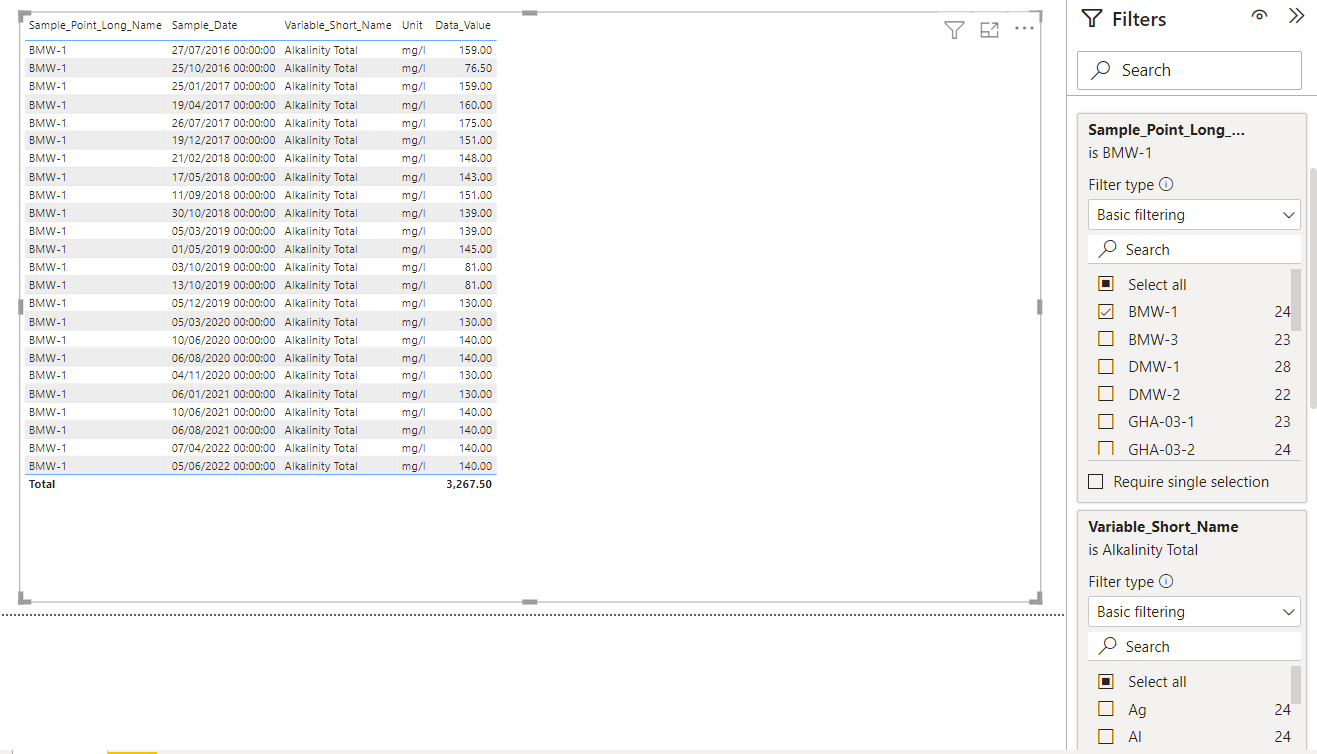
Once the connection has been set up you can preview the data. Further filtering can be applied to the visuals to restrict the data down further as required.
Data Fields
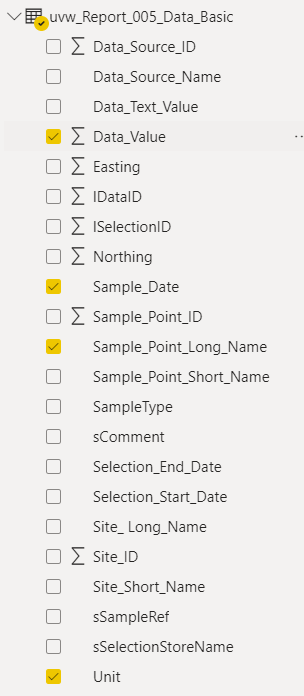
The report_ stored procedures (and SQL Views) will give you in almost all cases the fields you require, even those titled as basic. The below are the field names of the common items found. The naming in most cases is self-evident and common to any user of MonitorPro. A number of fields will generally have a long and short variant and will relate to the long and short names in MonitorPro.
Values – Values are stored as a numeric field Data_Value and a text field Data_Text_Value. Choose the field applicable to the output (for example graphing would use the Data_Value).
Site_Long_Name and Site_Short_Name – The parent grouping of Sample Points, aka Location/Monitoring Type. Location can also be used as a shortcut combining the Site and Sample Point Short name.
Sample_Point_Long_Name and Sample_Point_Short_Name – The individual locations where data is stored.
Variable_Long_Name and Variable_Short_Name – The substance being monitored, aka parameter. Measure is a useful shortcut as it’s a combined field of Unit and Variable. Unit can also be selected separately as Unit.
Dataset End and Start Dates – This is the date range of the underlying Dataset. These can be set to dynamic or fixed ranges in MonitorPro.
Data_Source_Name indicates the Data Source of the data. It’s used to differentiate out the source of data (field or lab for example). The data in the Dataset may already be refined or data can be further refined in PowerBI using this field.
Sample_Date – Is the date and time of the value
Including Breach/Exceedance Data
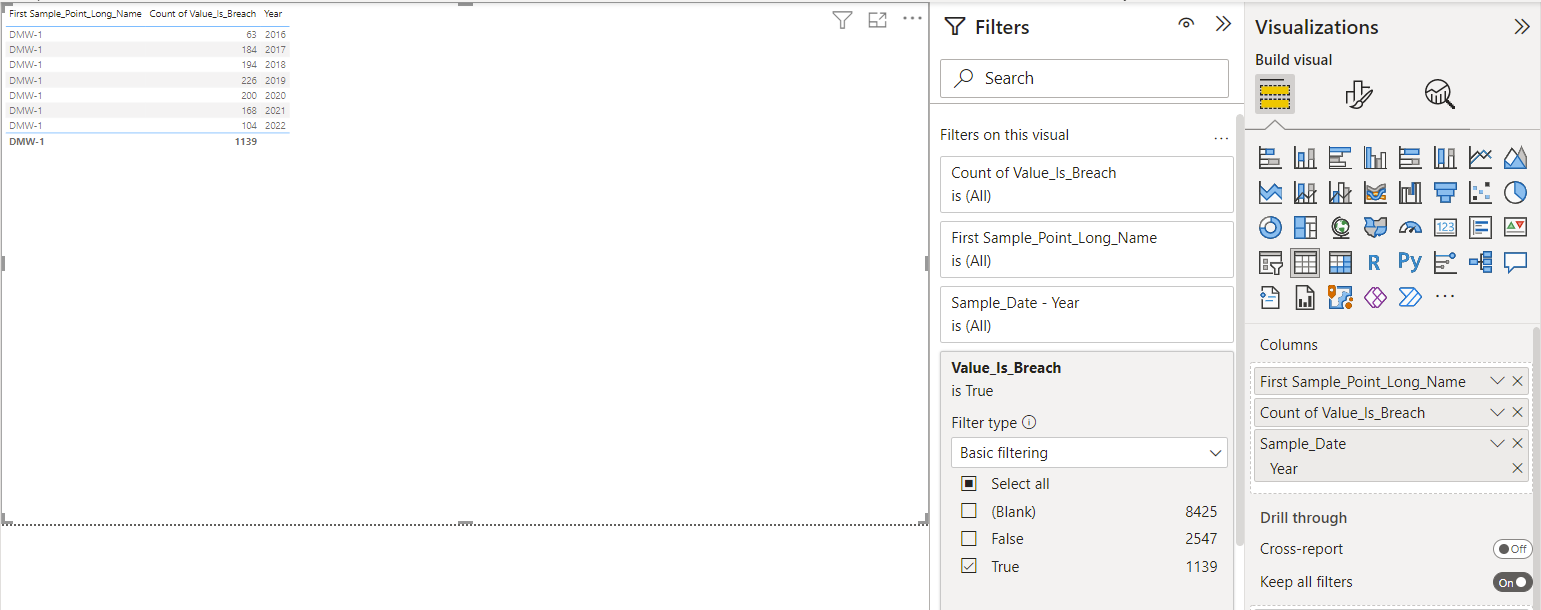
A number of the Stored Procedures contain compliance-based data, such as the applicable compliance associated with them and if a data point is breaching a limit. The example below includes this information.
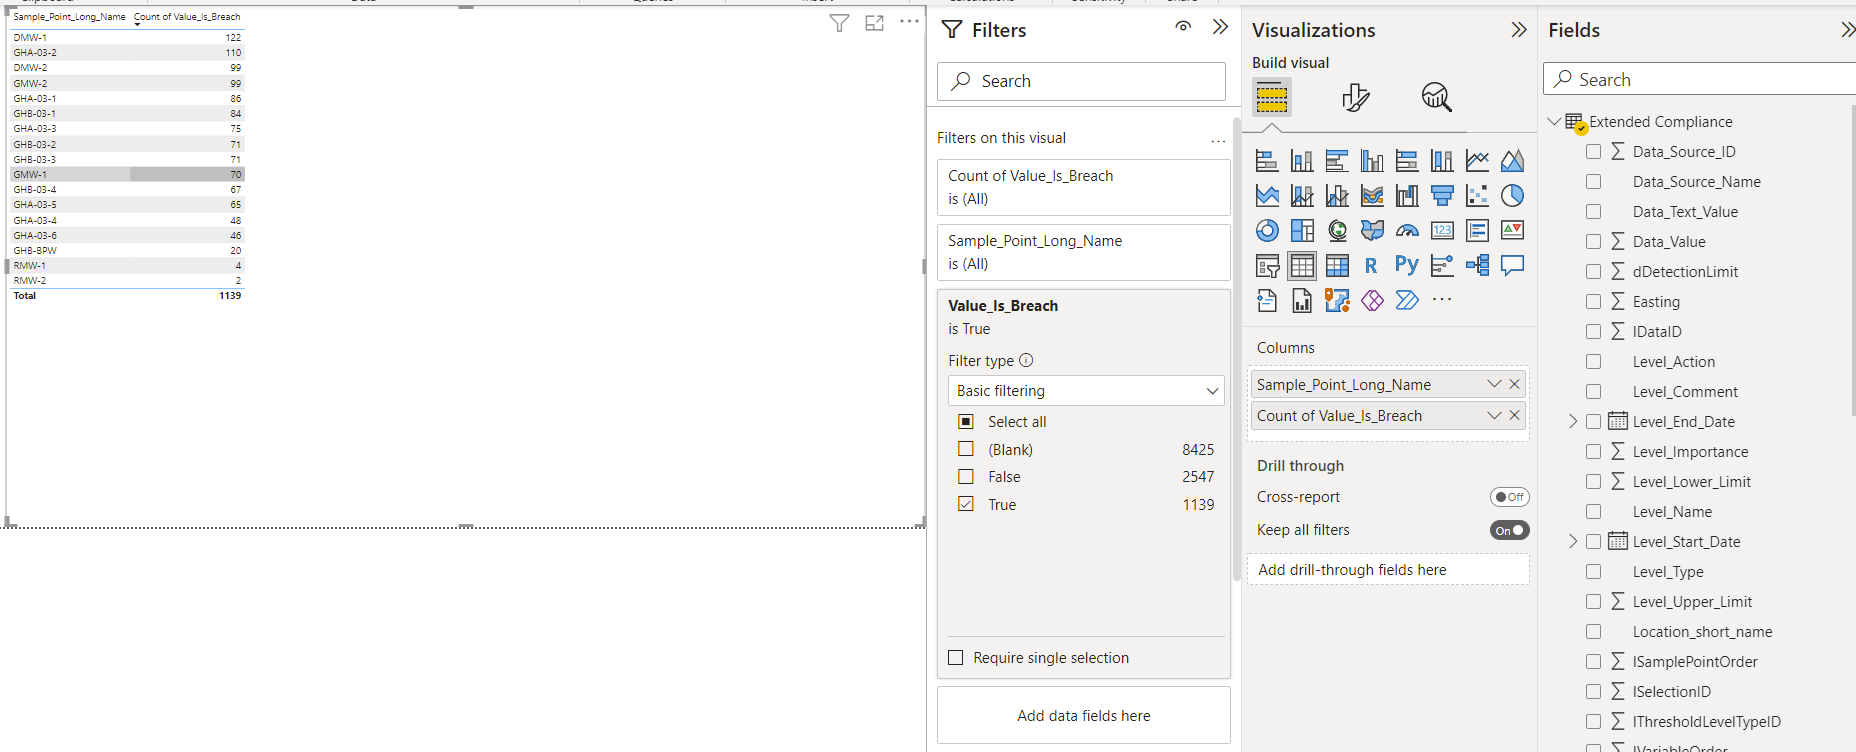
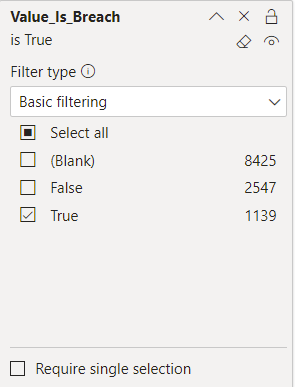
The data which has an associated breach can be filtered using the Value_Is_Breach flag. Those without a entry have no applicable compliance. Those False have applicable compliance associated with the value, but do not exceed that limit. Those that are True exceed an applicable compliance.
This gives options to filter on breaches, count the number of breaches present, or further refinement to include the name of the compliance or dates.
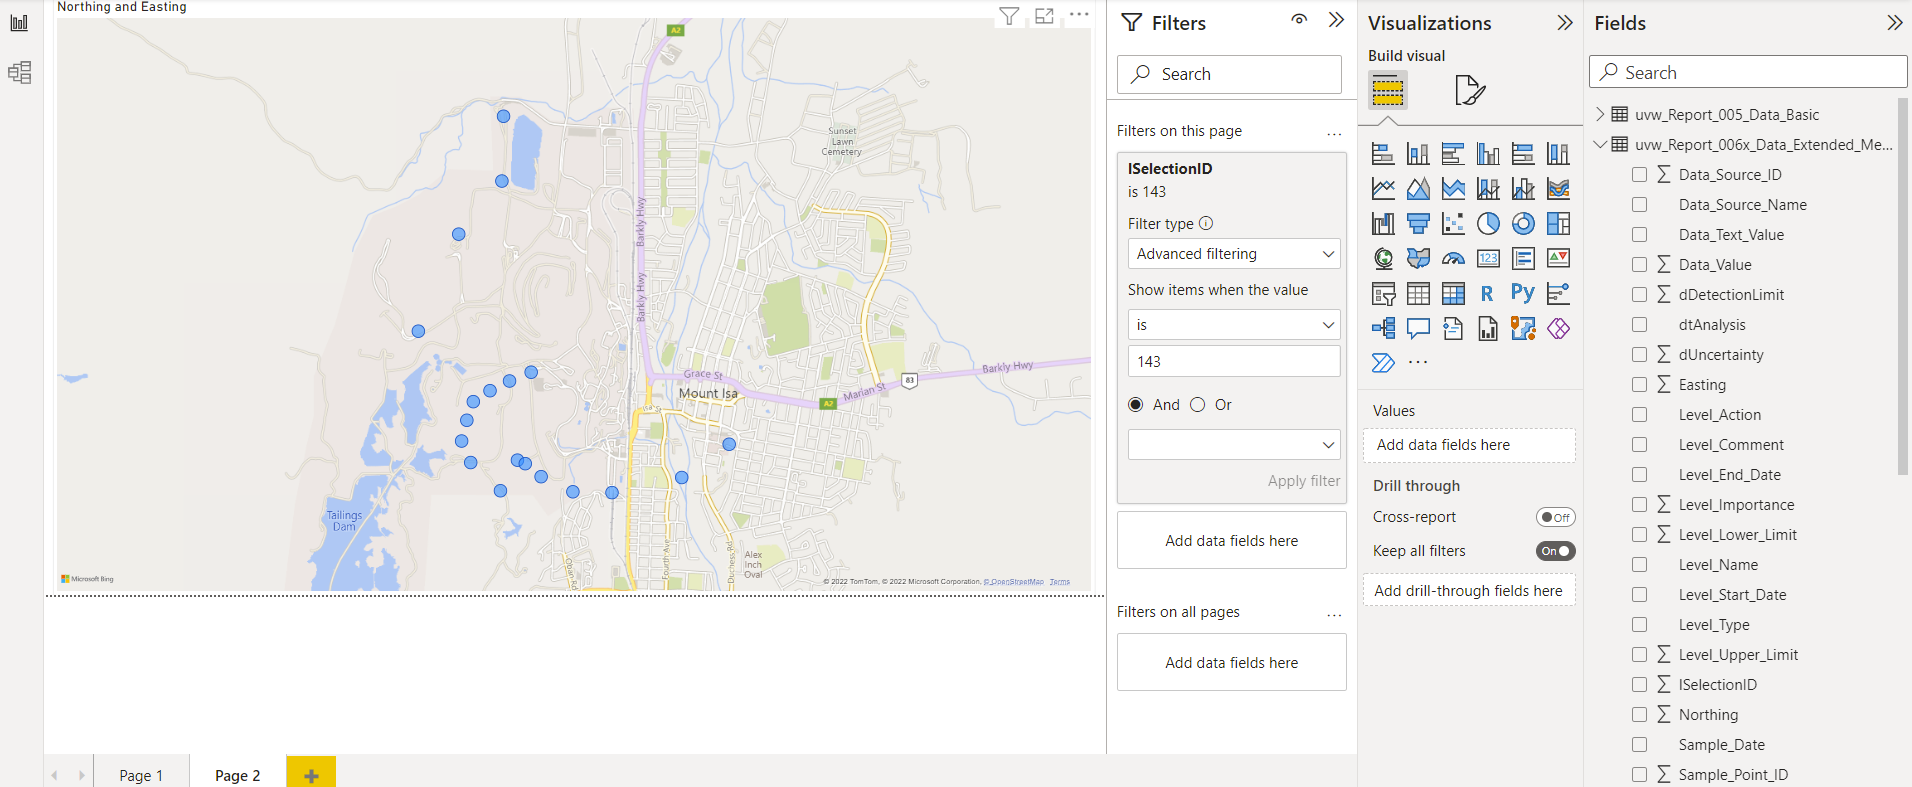
Mapping
Some Stored Procedures will contain coordinate information and can be used to plot the location information. Equally a connection directly to tblSamplePoint could be used for this purpose.
Further examples
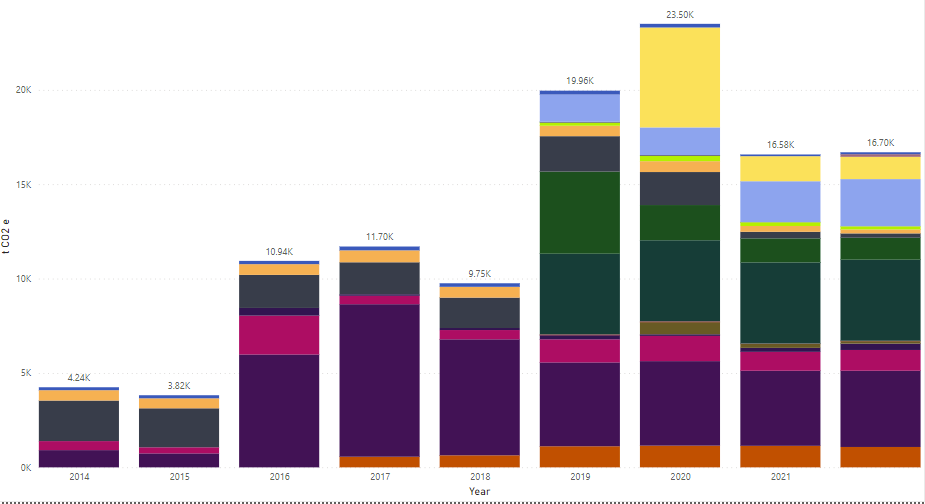
Below are some examples of how data might be presented using particular fields.
Carbon emissions data presented in a stacked bar by type of emission.