
How to use the MP-Desktop Calculator
Introduction
The Calculator Log displays all the runs the Calculator has completed in the time period selected. This can be refined based on the date range, and the Calculation Type. If users choose a specific Calculation Type they can then further refine the list to a specific Calculation.
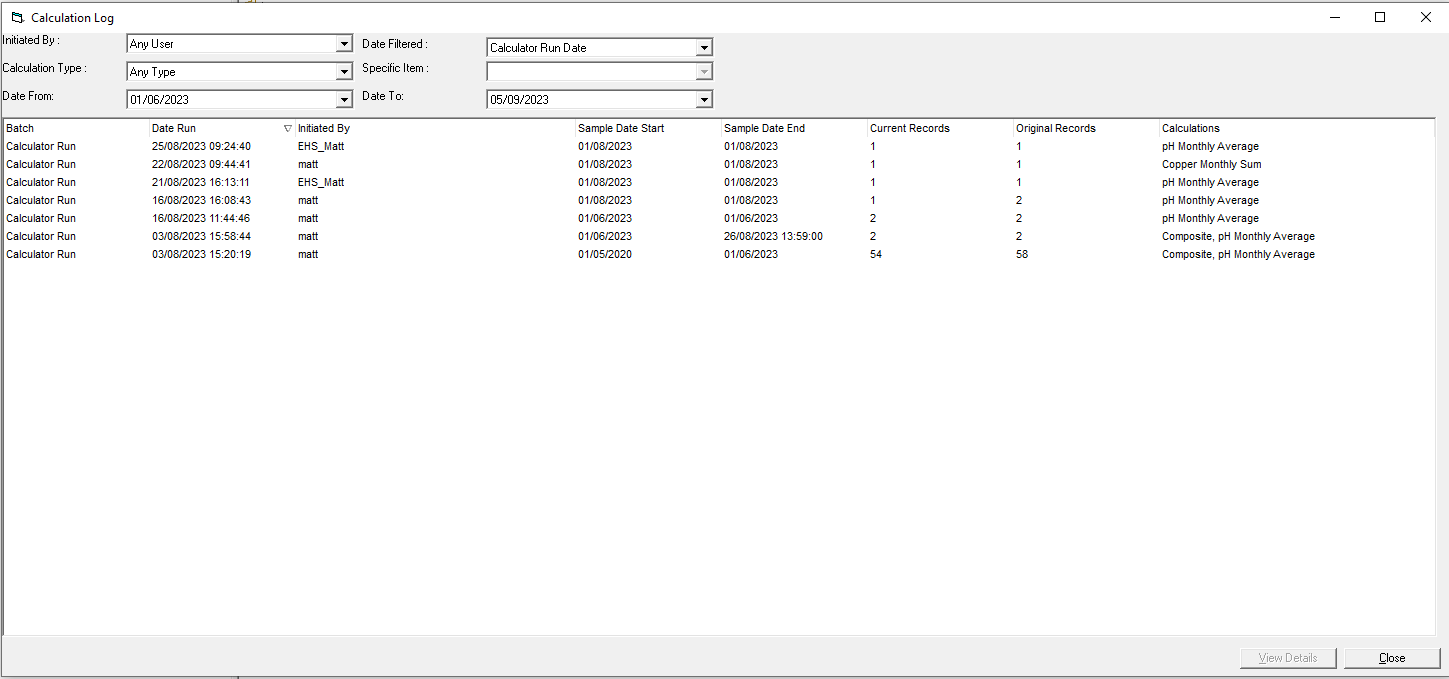
Date Run
The date run will be the date and time the Calculation was triggered. This will either be from the importation of data, the update of data or via a user manually triggering the Calculation. The Calculator runs on a schedule of 30 minutes and will start working on any new data imported prior to its previous run. Calculations triggered by a user can either be initiated immediately or on the next run of the Calculator.
Initiated By
Where Calculations were run manually by a user this column will display that user's name. If the Calculation was automatically triggered by the importation of data it will say Unknown/Automated.
Sample Date Start and End
These dates will indicate the range of data selected or the range of data affected (again depending if the calculation was run manually or not).
Current Records and Original Records
The Original Records count will display the number of records that were included in the initial calculation run. The Current Records will display a count from that calculation run which still forms part of that batch.
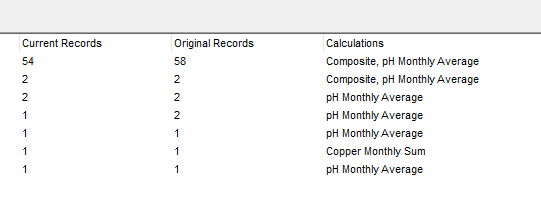
Where calculations are run multiple times these Current and Original record counts may not always tally. For example in the above. 58 records were first calculated over the two Calculations, Composite and pH Monthly Average. Lately, these Calculations have been run again (although for different time periods). 2 of the records overlap those from the first run (those associated with the pH Monthly Average Calculation). A third run of the pH Monthly Average then triggers, overlapping again the first.
Effectively the first and second set of records have been marked as deleted and the initial batch remains with them in the history. The most recent record will always reside with the latest batch. This can be seen in the data point property's last update field.
These types of scenarios are more common where users have manually run calculations (perhaps making corrections to the Calculation logic), and they had previously run automatically. Reimportation of data will also display like this and will Aggregate calculations where they update each time data is added.
Note
It can also be worth understanding the 'area of effect' when running a calculation. If a user marks up a Calculation to be triggered and there are overlaps between this and other Calculations, multiple Calculations may appear in the run. This is normal behaviour. If Variable A is imported into MonitorPro all Calculations which include that Variable for the respective Sample Points will be triggered. In the same way, if 10 Calculations include Variable A for a common set of Sample Points, recalculating 1 of these will trigger all 10 to run.
It's generally best to leave the Calculator to run on import or update of data. Rerunning of Calculations should really only be required when setting up Calculations for the first time. Continually rerunning Calculations will create a significant amount of data histories for each record. If Calculations don't run automatically it is often attributed to the Calculation Order.
Drill Down
Clicking on a row will bring up the Calculation batch details. From here users can see the Calculations which form part of that batch. Users can also view a Quick Table of the data.