
How to produce Plots in MP-Desktop
Introduction and Graphing Types
Several types of graphs are available to users in MP-Desktop. These can be accessed from each Dataset output, or when drilling into data via a Sample Point, Variable or Data Source.
General Time Series Graphing
Time series graphing in MonitorPro Desktop is true time series. This means that data points with varying time gaps are displayed correctly. For three readings, one in February, one in March, and one in October, a non-time series graph will space these three points evenly. True-time series will leave a larger gap between March and October.
Quick Graph
When drilling into data, the Quick Graph can be used to represent data graphically for your chosen records. Either when drilling into a Quick Table from a Sample Point, Variable or Data Source or from a Quick Table via a Dataset.
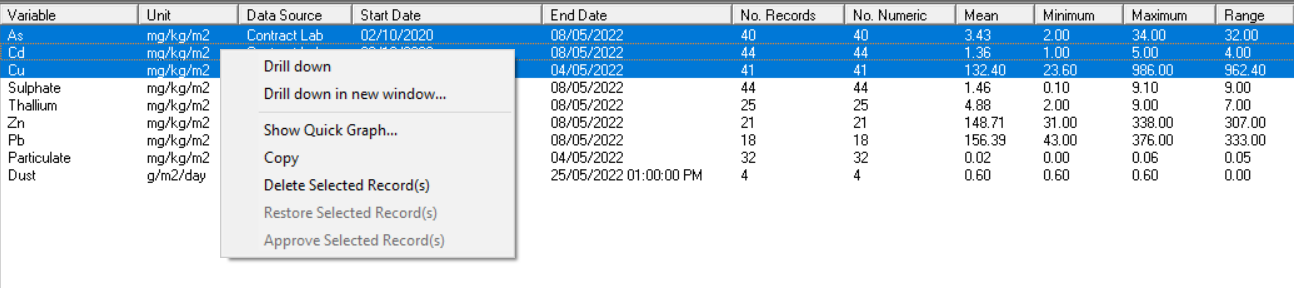
Users can right-click a series of data to show the Quick Graph option or multi-select using Ctrl and right-click to select a number of series. For example to plot multiple Variables on the same graph for a particular Sample Point.
Note
When a Graph is created it will open in a new window. To go back to the Quick Table simply close the window or use the Back button to return.
Time Series
The normal time series will draw lines per Sample Point, Variable and Data Source. One line for Borehole 1 for Chloride from ABC lab for example.
Time Series (Aggregated Sources)
Time series (Aggregated Sources) draws a line per Sample Point and Variable only. This is useful where data has come from multiple Data Sources over time, yet only one line for all is desired. Where data exists for Borehole 1 for Chloride from lab ABC and Lab DEF, but a single line for Borehole 1 for chloride is required (rather than one series per laboratory).
Time Series Summary
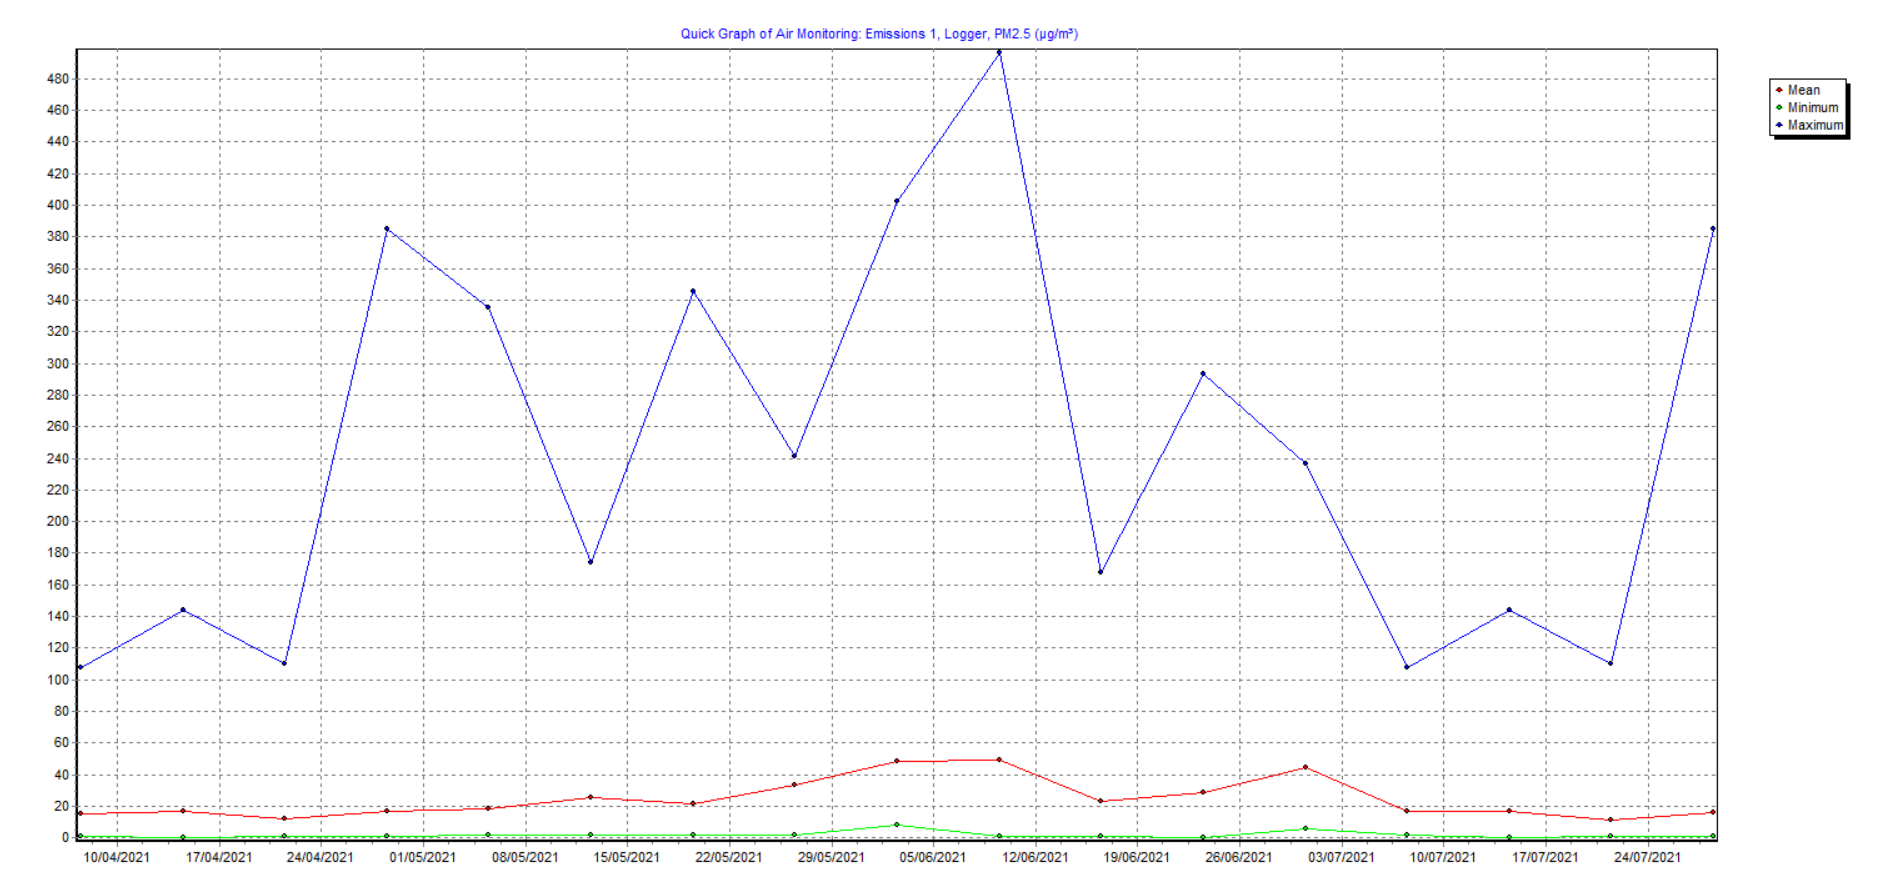
The time-series summary displays the summary level of data (depending on settings). This is useful where high volumes of data need to be graphed. The frequency and set point for the summary function is set in the System Options.
When drilling into data either from a Dataset or a Sample Point, high volume data when graphed will initially be summarised such as the below, showing a periodic min, max and average.
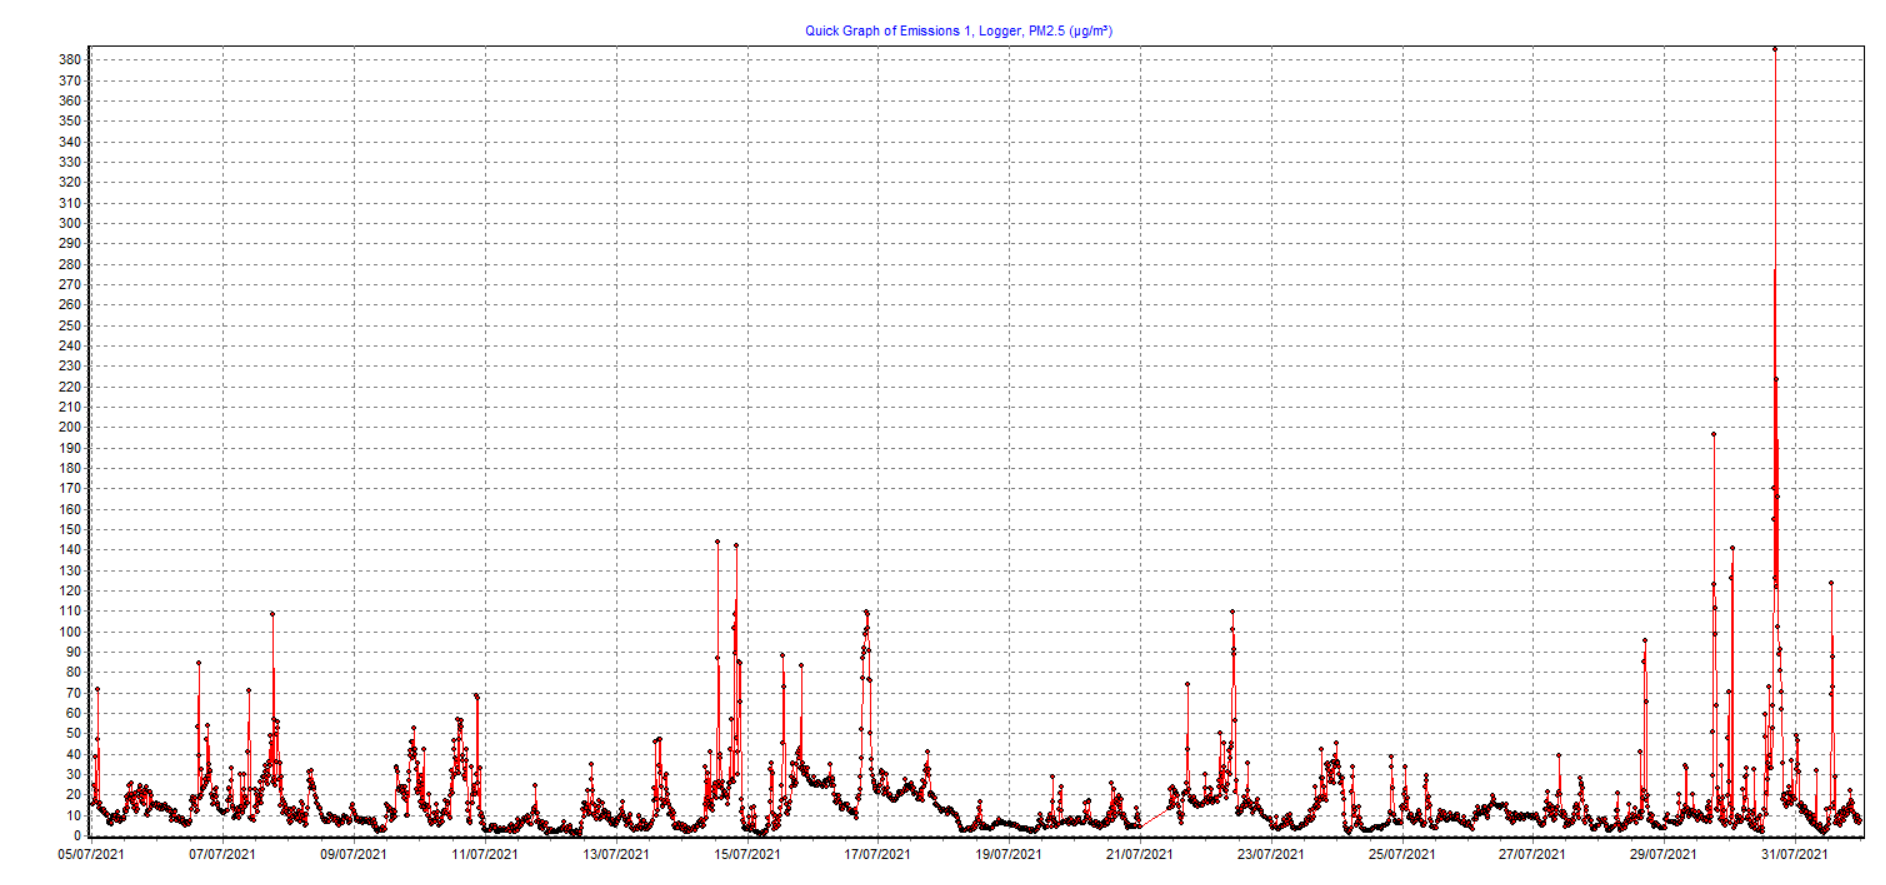
To graph, the data for a particular period click on the point, right-click and click Quick Graph.
Navigation
Zoom
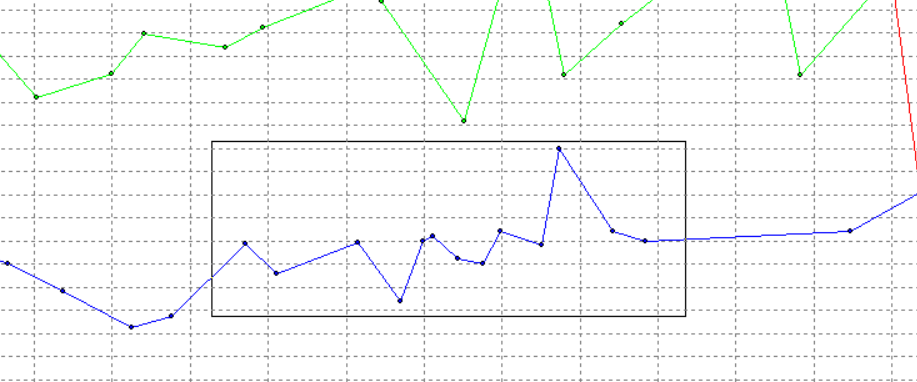
Users can zoom in to a Graph by drawing a box with their mouse from left to right, to highlight the area of interest. To revert the zoom back, draw a box from right to left in any area of the Graph. There is also a zoom-out option on the right-click menu anywhere on the Graph.
Point Properties
To view the properties of any data point hover the mouse pointer over the point of interest and right-click. In the menu will be options to choose the properties of the Data, the Sample Point, Data Source or the Variable.
Settings
From the menu bar under Graph are further settings to manage the look of the Graph. Standard settings such as titles and legends can be manipulated. A number of series options are also available to amend colour and format.
Template
Templates can be saved and loaded from the menu bar under Graph. These templates can be used to save setting changes for later applications to provide consistency of output.
Note
Not all settings can be saved in the templates, these are limited to general formatting amendments.
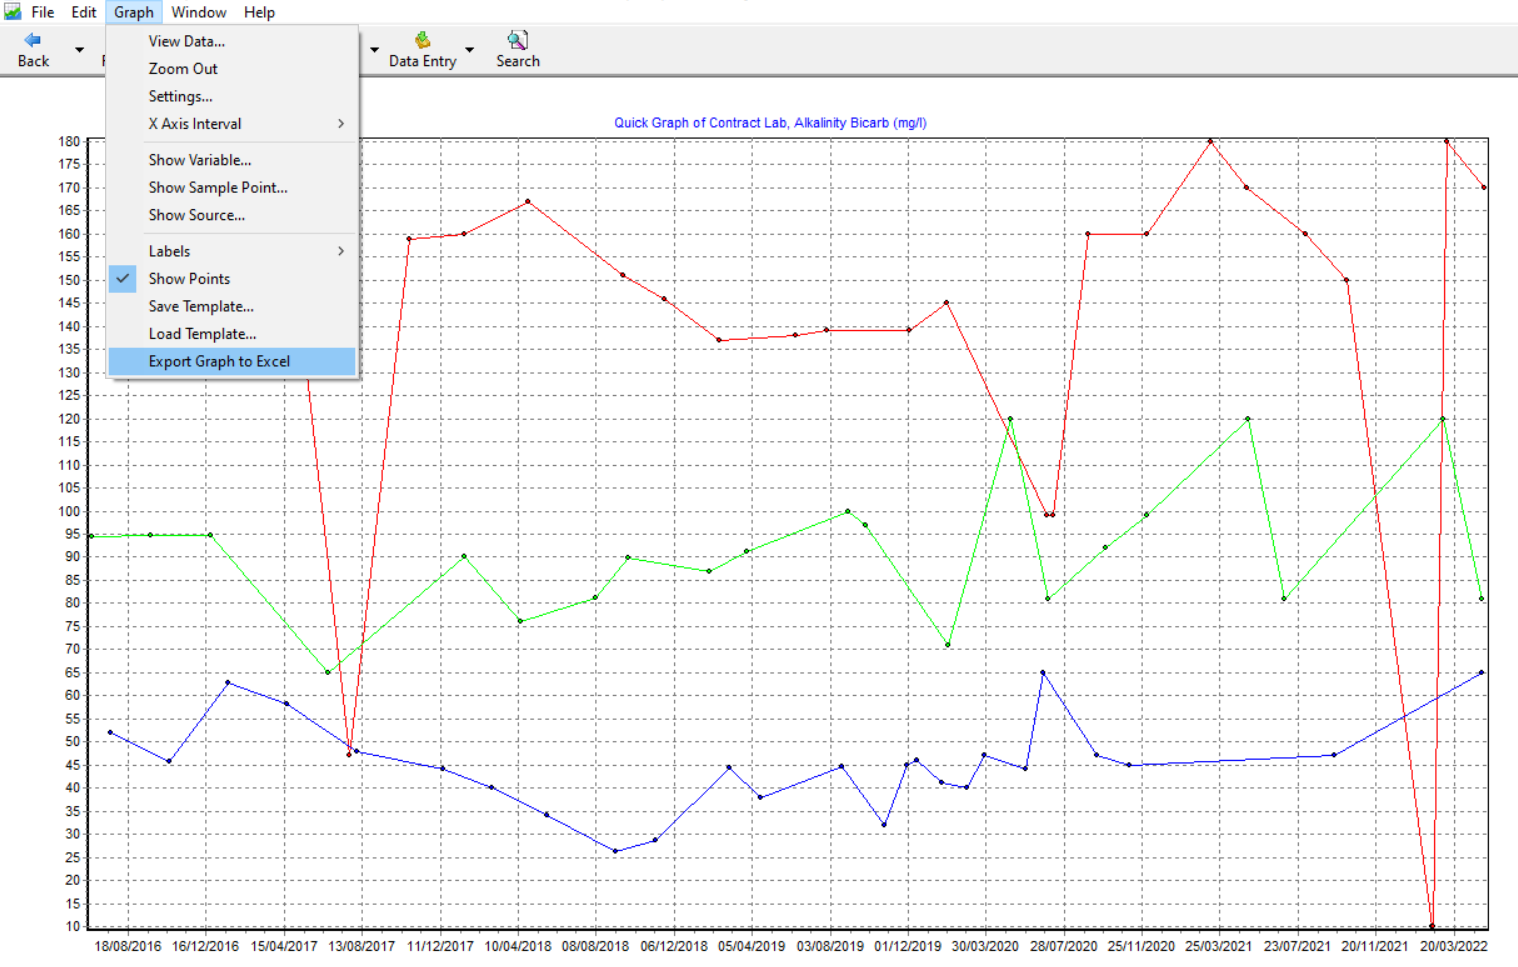
Exporting
Graphs can be exported to Excel from MonitorPro Desktop, to save time in exporting data and then recreating the plot. From the menu bar select Export Graph to Excel. To use this functionality users will need Excel installed on their PC.
Users will then be presented with a menu of options for the export.
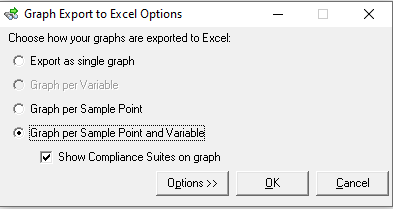
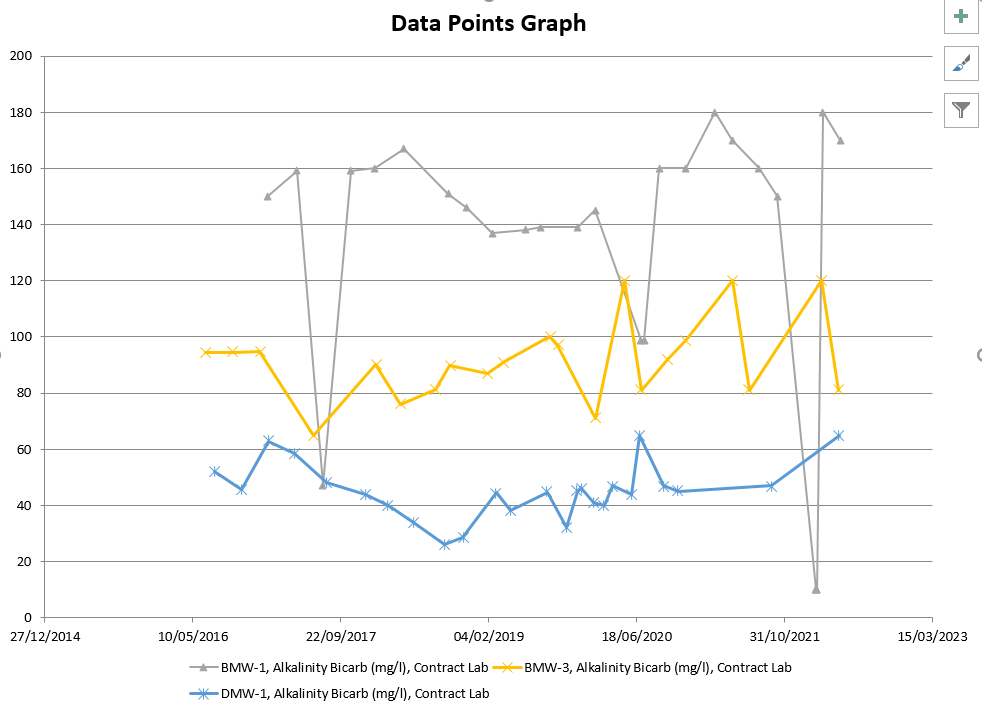
Export as a single graph - In this mode, the data will be exported in one graph, with a single page of data.
Export per Sample Point - In this mode, the data will be exported in one graph for each Sample Point chosen, with a single page of data per Sample Point.
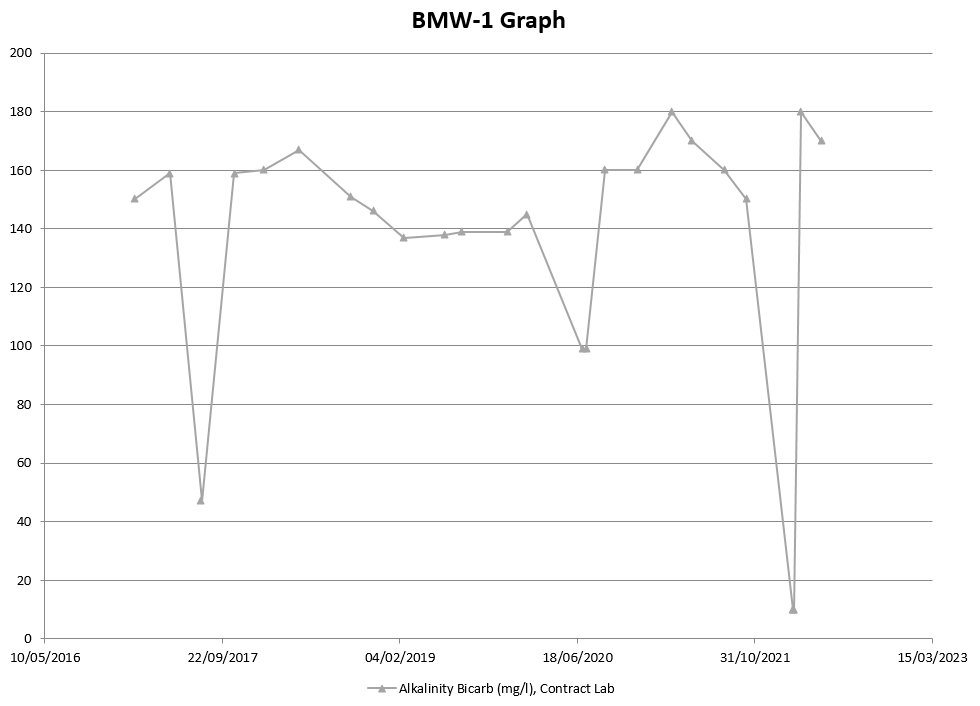
Export per Sample Point and Variable - In this mode, the data will be exported in one graph for each Sample Point and Variable chosen, with a single page of data per Sample Point and Variable.