MP-Web Sentinel Mapping
Sentinel Satellite - https://apps.sentinel-hub.com/sentinel-playground/
Introduction
The Sentinel Satellites are part of the Copernicus Programme to provide high-quality observation capacity across the globe. The Sentinel 2 data available in MP-Web uses the multi-spectral data made available by the satellites through the visible, near-infrared, and short-wave infrared spectrum. These different bands can be interpreted to provide the user with a representation of a number of environmental factors such as vegetation coverage, moisture content, and the location of water bodies. These images have the advantage of being updated routinely, which gives the ability to view changes over time.
Layers
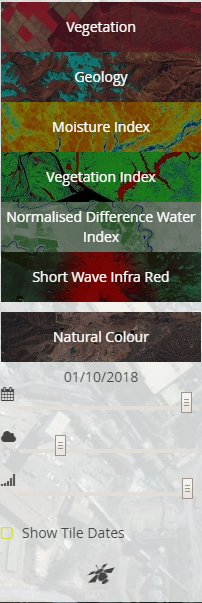
Simply select the image type you would like to display. It can be turned off by selecting it again, or selecting another layer.
Layer Types
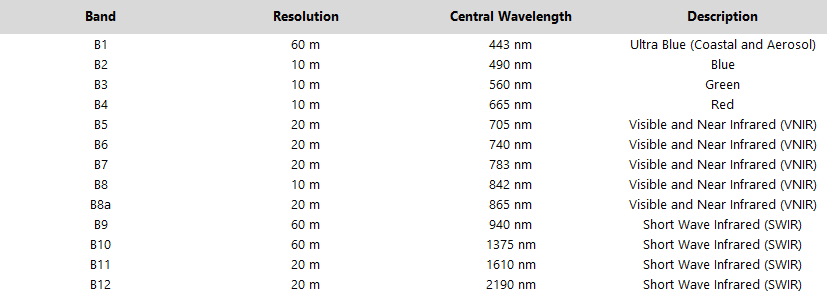
Sentinel-2 carries a Multispectral Imager (MSI). This sensor delivers 13 spectral bands ranging from 10 to 60-meter pixel size.
The (B2), green (B3), red (B4), and near-infrared (B8) channels have a 10-meter resolution.
The red edge (B5), near-infrared NIR (B6, B7, and B8A), and short-wave infrared SWIR (B11 and B12) have a ground sampling distance of 20 meters. Finally, the coastal aerosol (B1) and cirrus band (B10) have a 60-meter pixel size.
Natural Colour (B4, B3, B2)
The natural colour band combination uses the red (B4), green (B3), and blue (B2) channels. It's a representation of how the human eye sees. Vegetation is green, urban features, appear white and grey and water blue.

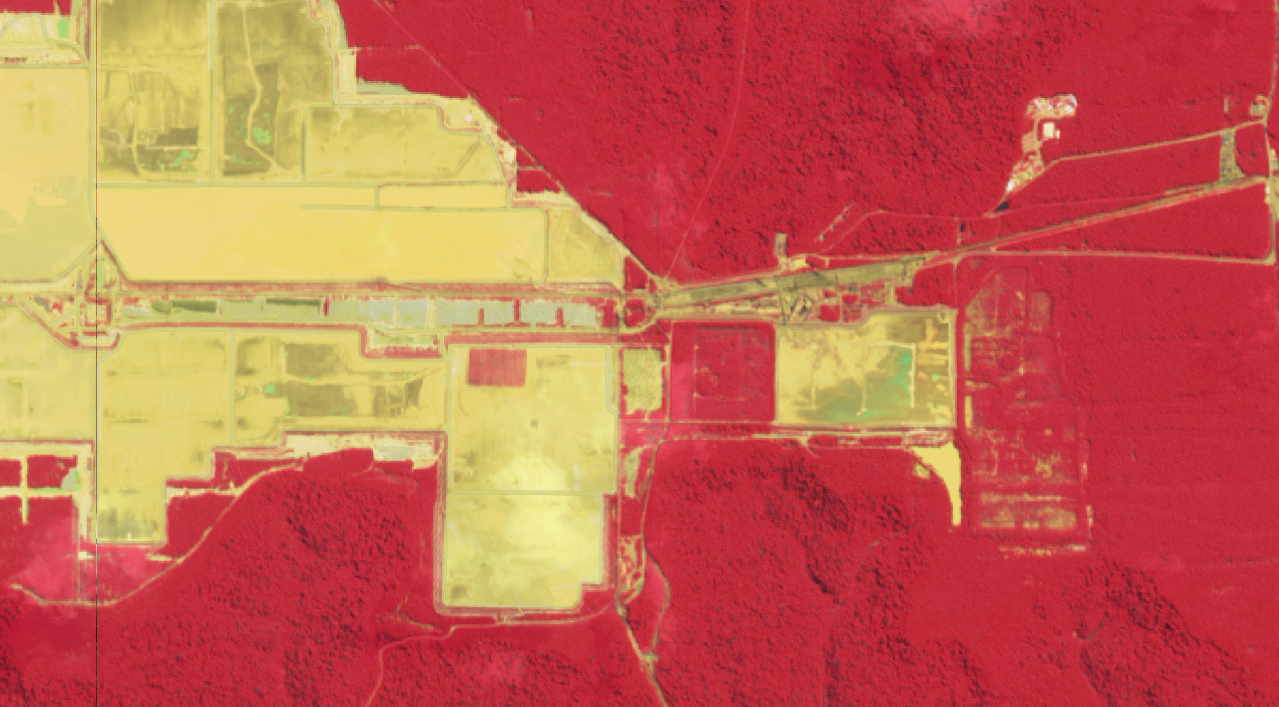
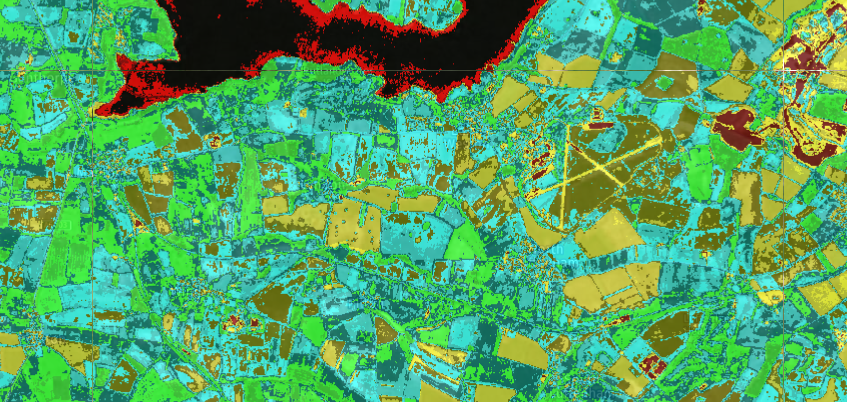
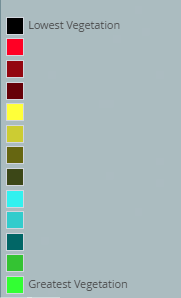
Vegetation (B8, B4, B3)
Vegetation gives a scale of vegetation as a red colour. It can be used to see areas of clearing or revegetation if used in combination with the time scale slider.
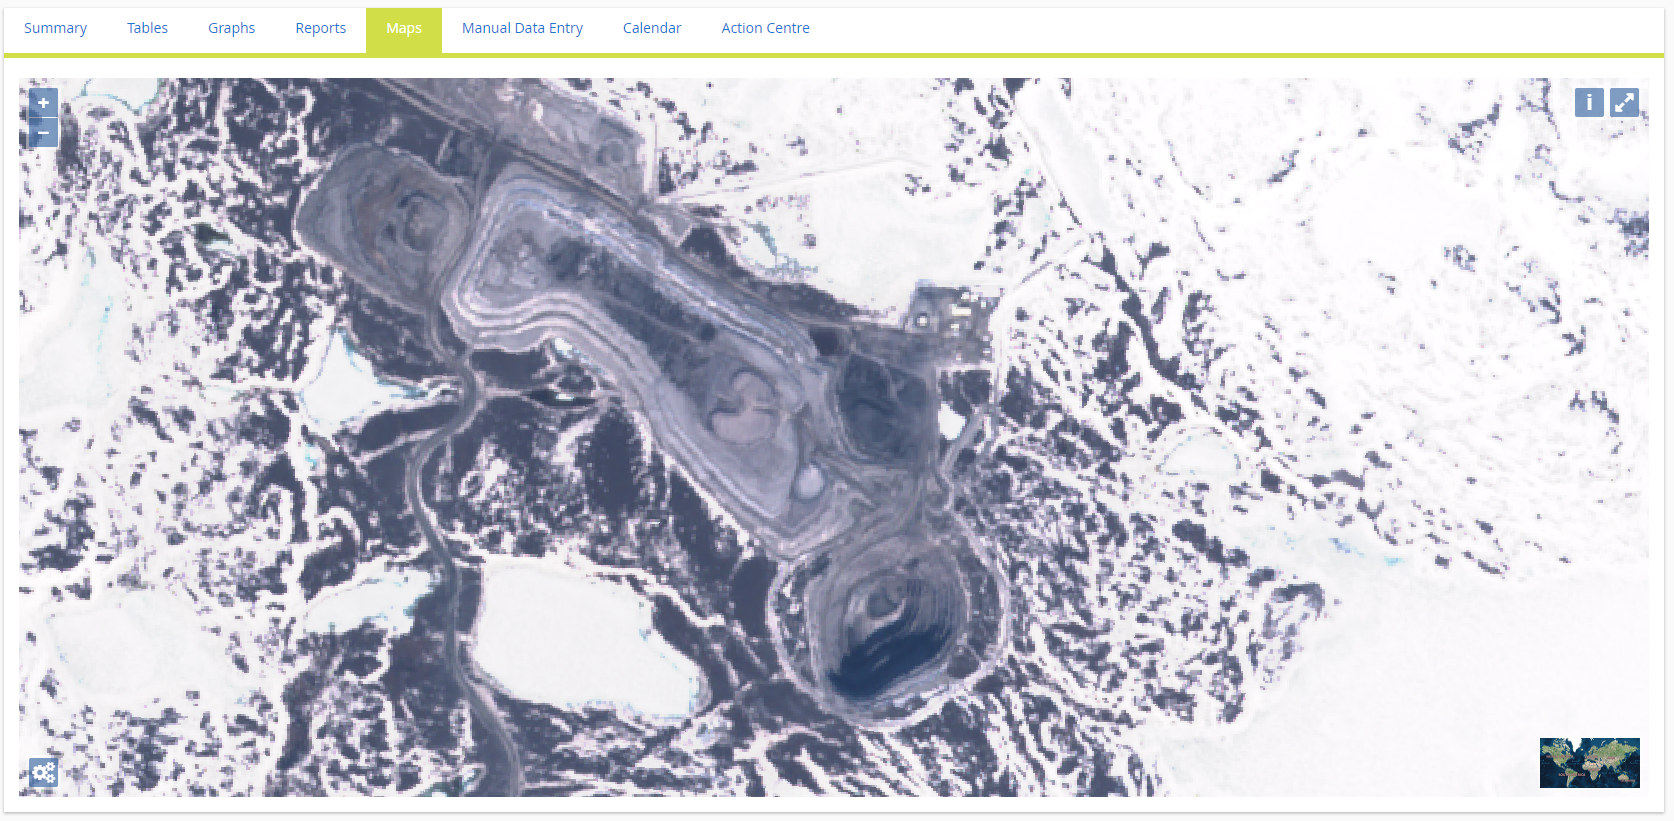
Snow cover
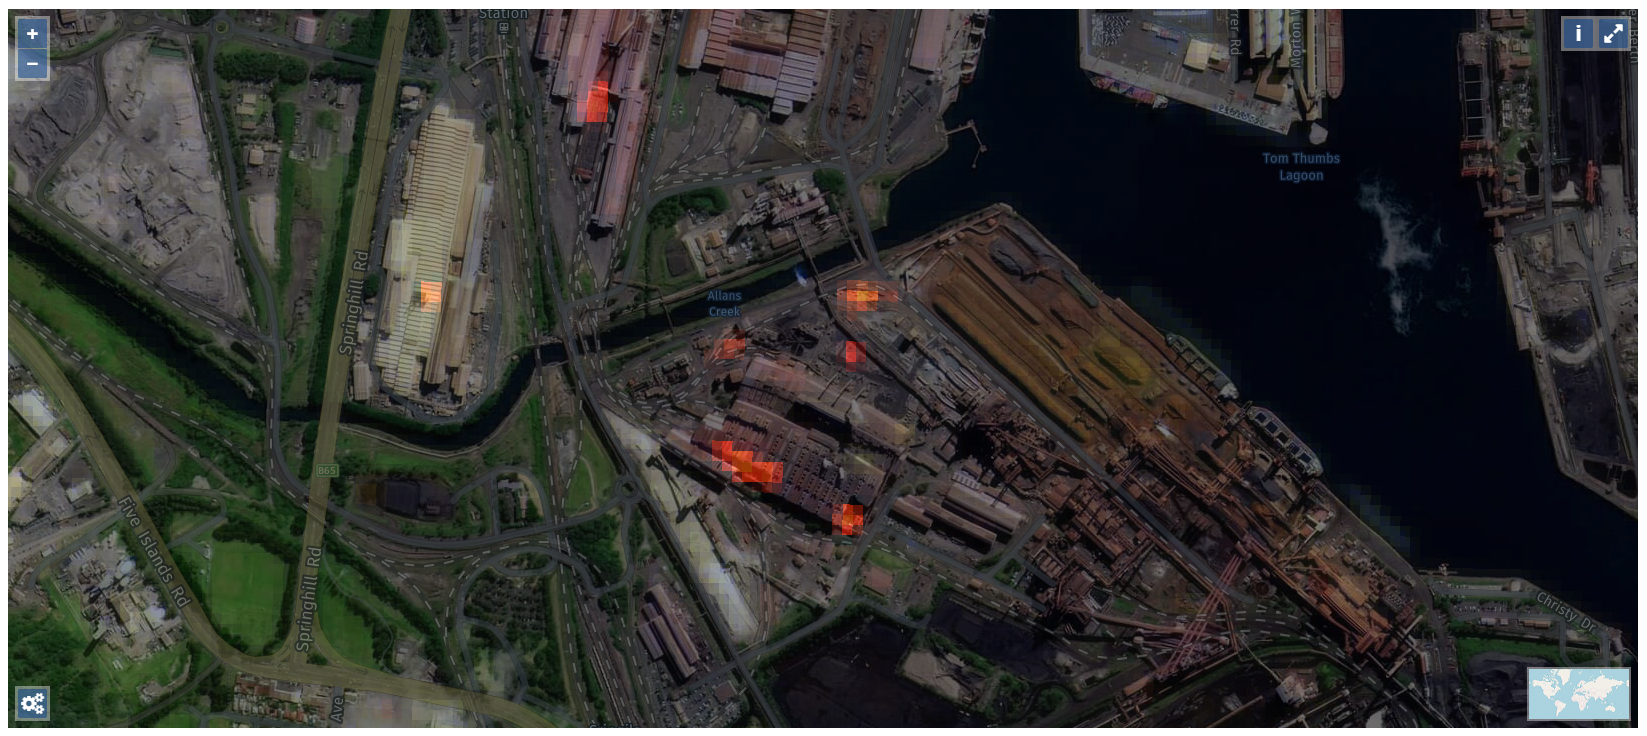
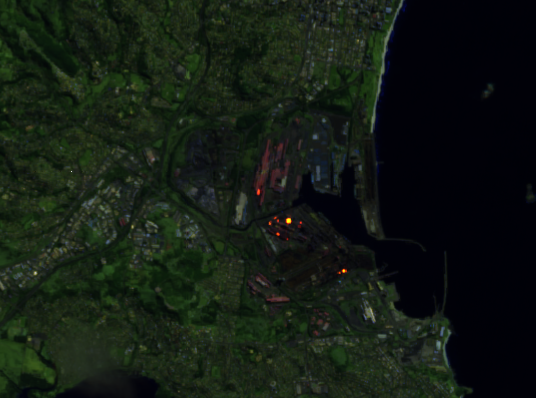
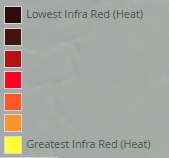
Short wave Infra-Red
The Infra-Red can be used to signify areas of heat such as these from a heavy industrial site.
Geology (B12, B11, B2)
The geology band combination can be used to identify geological features. This includes faults, lithology, and geological formations. By leveraging the SWIR-2 (B12), SWIR-1 (B11), and blue (B2) bands.

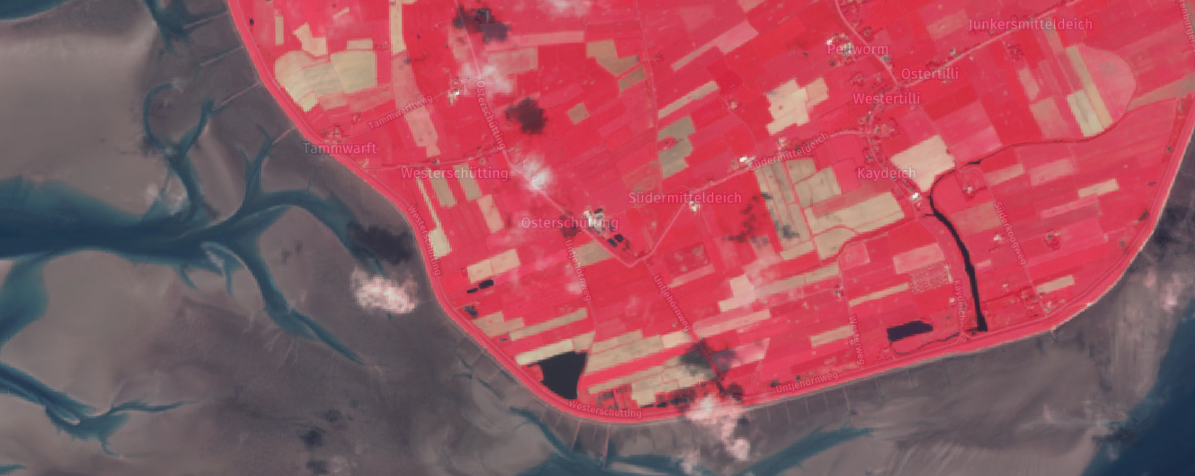
Vegetation Index (B8-B4)/(B8+B4)
Because near-infrared (which vegetation strongly reflects) and red light (which vegetation absorbs), the vegetation index is good for quantifying the amount of vegetation. The formula for the normalized difference vegetation index is (B8-B4)/(B8+B4). High values suggest dense canopy and low or negative values indicate urban and water features.
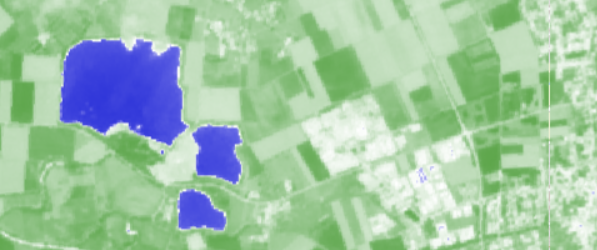
Normalised Water Index (B3-B8)/B3+B8)
This layer highlights water bodies as blue and land as green.
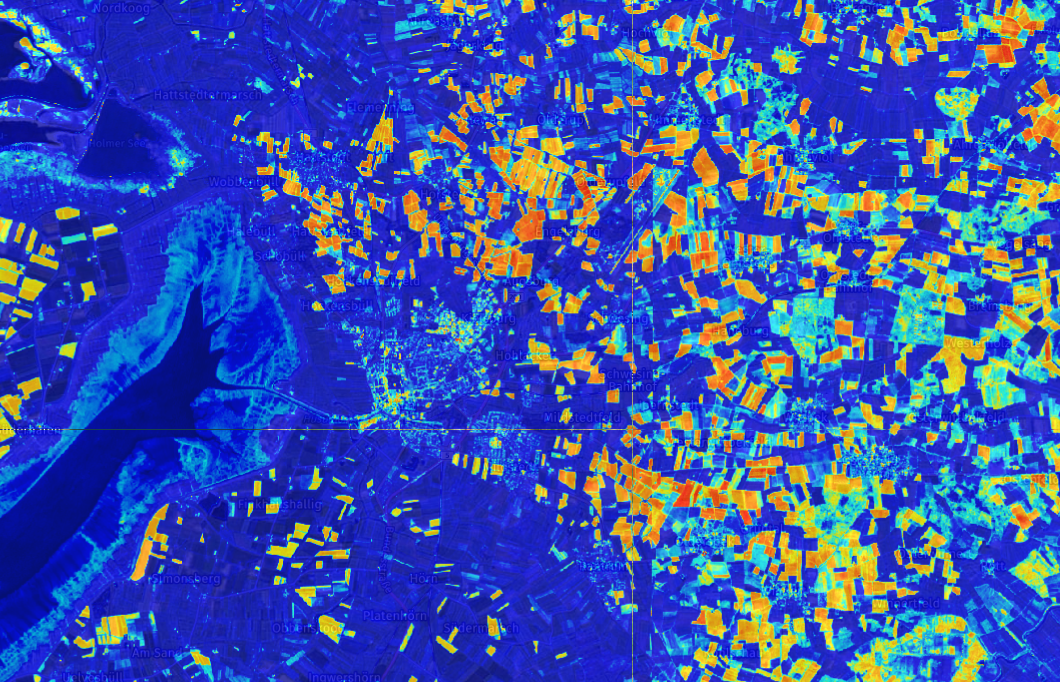
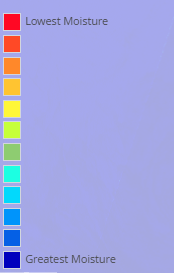
Moisture Index (B8A-B11)/(B8A+B11)
The moisture index can be used for finding water stress in plants. It uses the short-wave and near-infrared to generate an index of moisture content. In general, wetter vegetation has higher values. But lower moisture index values suggest plants are under stress from insufficient moisture.
Changing the date of the layer
The calendar slider enables you to locate an image from the past. The imagery starts from around 2015 (when the satellite started taking images). Simply move the slider to the approximate date you would like to see images. MP-Web will find the image on that date or as close as possible, prior to the date selected. If the image doesn't return the desired output you can increase the cloud cover slider. This will return images with higher cloud cover but likely nearer to your desired date. The importance of this and how close to your selected date the images are will be highly dependent on your location and the time of year. The default cloud cover is set to 20% to give a good range of images but to also ensure the images that are displayed are useful.
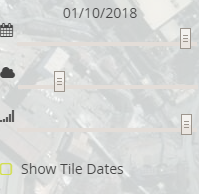
If you would like to see the exact date of each image tile then you can turn this on and off using the Show Tile Dates option in the Sentinel menu. For larger areas, the tile dates may be different depending on the track of the satellite and the cloud cover on those days.
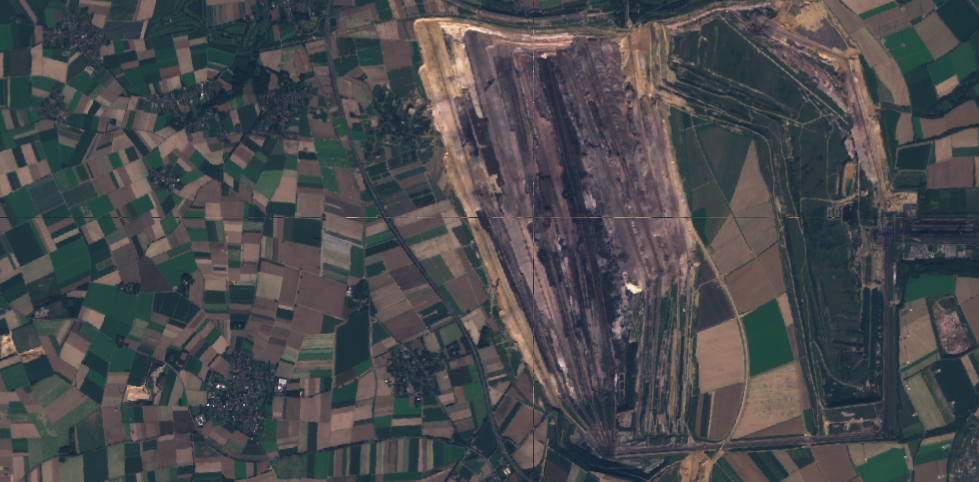
An image from Summer
And from Autumn/Fall
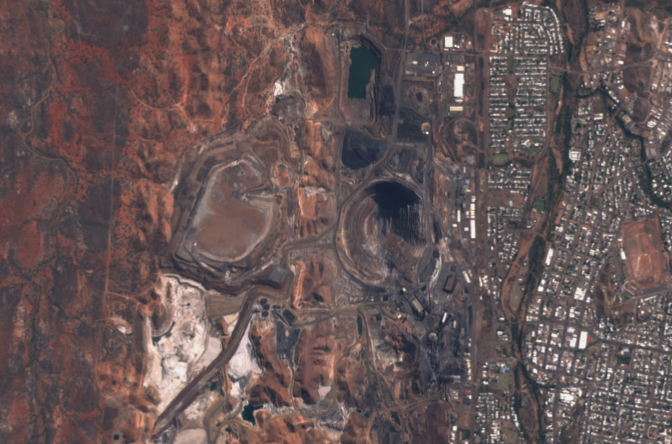
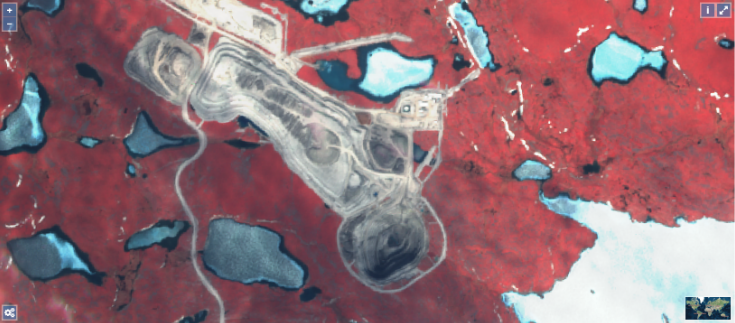
German Coal Mine 2016
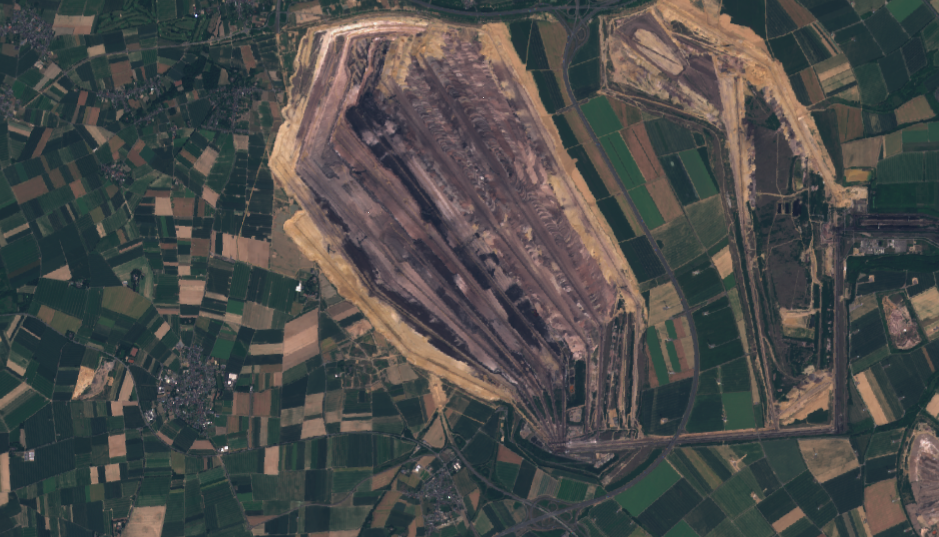
German Coal Mine 2022
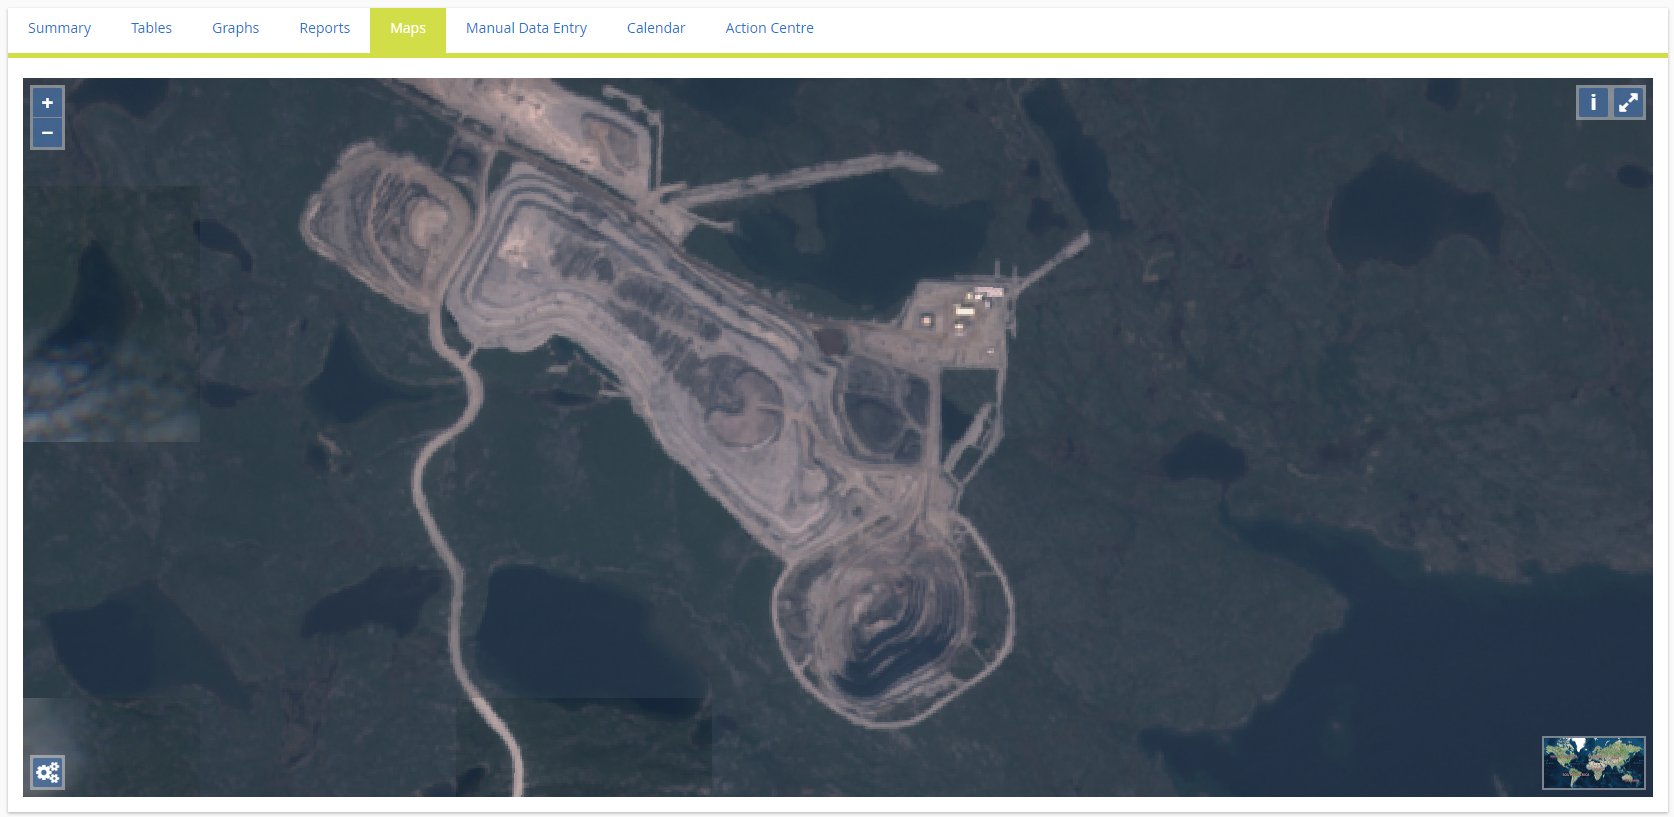
Transparency
The transparency of the Sentinel layer can be adjusted as needed. This can be useful to display the underlying HERE Satellite images but with the Sentinel overlay. The example below shows the high resolution HERE image with the Sentinel Infra-Red overlayed, showing areas of heat source from the local Industry.