
MP-Web Polar Chart/Wind Rose
Introduction
A Wind Rose chart represents wind speed and direction distribution, making it easier to establish trends in wind patterns over a defined period. The chart type also enables a broader scope of applicable Variables to be included to show concentration distribution against wind direction, which is more broadly named a Polar Chart.
To create a polar chart/wind rose, you will need data in your database that contains the wind direction in decimal degrees and wind speed or applicable concentration Variable (dust volume, for example).
The data does not need to belong to the same Site/Aspect Type or Sample Point. However, they should be comparable at least to the same day.

Select the location (in case the Dataset contains more than one) and the sampling points you want to represent. Select the appropriate wind speed/concentration and wind direction variables. The direction must be in a valid decimal degree format, but the speed/concentration can be in any unit (mph, kph, m/s, etc.).
Users should create a specific Dataset for this purpose, including only the relevant variables. The period of the Dataset will determine the period of data used in the plot. Click the Draw Graph to create the graph.
The orientation of each segment will indicate the wind direction (North being 0° and East 90°). The segments' length will indicate the wind/substance distribution (in percentage of the overall). The longer the wedge, the more significant the distribution in that particular direction.
The colours represent the distribution of the wind speed. The longer the area of any particular colour, the more significant the prevalence of that speed/concentration.
The example below shows the significant prevailing wind direction between the East, South, and West. The most considerable distribution is to the East, accounting for nearly 14% of the overall Dataset. We can also conclude that most of this is at a speed between 1.43 and 4.29 m/s.


The following example represents Cadmium concentrations from dust samples using the wind direction to denote the likely deposition direction. The most extensive wind distribution is to the Southeast (between 90 and 160 degrees). Instead of representing the wind speed, the key now represents the concentration distribution of the dust sampling at the chosen location. The majority of the Cadmium is under 7.14.

Additional Settings
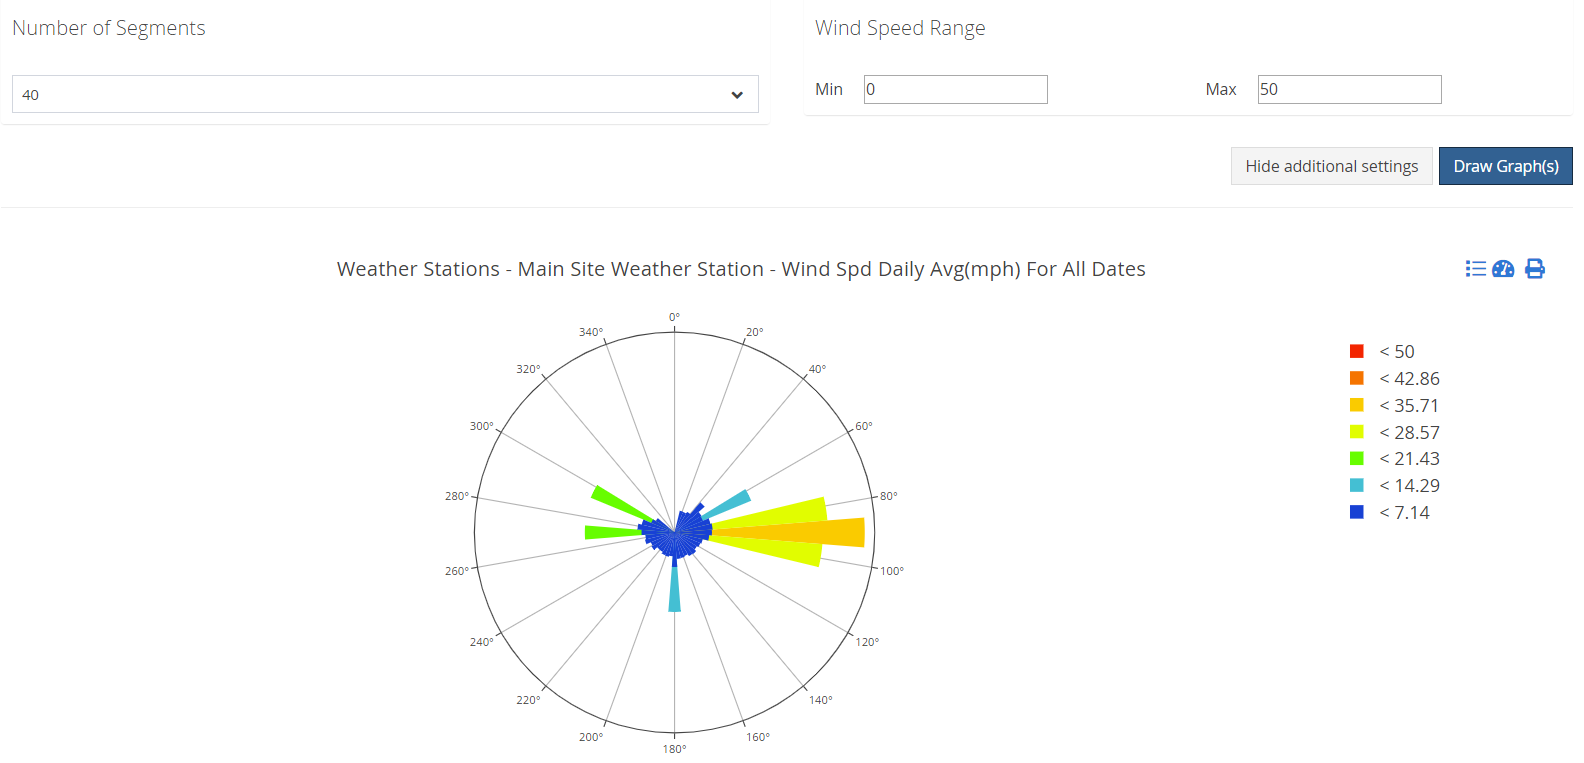
The number of segments and the scale used by default can be edited in the Administration/Advanced Settings section of MP-Web. To make sure your charts are consistent, it is recommended that you edit your settings as necessary and then keep them so you can make comparisons over time. However, you can change these settings when the chart is generated using the Show Additional Settings button. This will allow you to change the number of segments and ranges. It is more likely these will need to be updated when generating Polar Charts vs Wind Rose, as the underlying data is expected to be more variable.
The compass rose shown below contains the same data as the previous example but has more segments (thus more "atomization" in terms of wind direction). The maximum speed range has been reduced to provide further categorisation of wind speed depending on the dataset used.
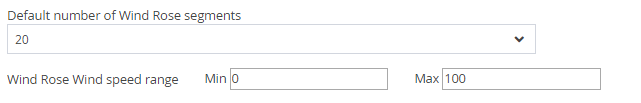
In the Administration/Advanced Settings section, you can edit the default settings for the number of segments and the minimum and maximum scale of the graphs. Any changes made here will affect all MP-Web users globally. These configuration options are only available to users with the administrator role.
The match by is more applicable when producing Polar Charts, as the data is likely not coming from the exact location as when creating a Wind Rose. Therefore, the data frequency or times may not match exactly. To compensate for this, the Time option can be unticked, and Wind Direction data for a given day will be used to match the concentration data. Data Source and Sample Type are unticked by default, but selecting these options will make the data matching more granular, only matching data to the same Data Source or Sample Type.
