- Knowledge Base and Manual
- MP-Web
- Dashboard
-
Installation
-
Integration
-
MP-Desktop
-
MP-Web
- Introduction
- Access
- Side Bar Navigation
- Dashboard
- Favourites
- Datasets
- Summary Tab
- Tables Tab
- Export Tab
- Graphical Tab
- Report Tab
- Mapping Tab
- Manual Data Entry
- Calendar Tab
- Action Plans
- Custom Forms
- Contacts and Alerts
- Compliance
- Task Scheduler
- Monitoring Scheduler
- Calculator
- Data Entry
- Email Importer
- Object Management
- Obligations
- Policies
- Administration
- Administration - Manage Users
- Administration - Datasets
- Administration - Internationalisation
- Administration - Email Importer
- Administration - Monitoring
- Administration - Advanced
- Culture
-
MP-Field
-
Release Notes
-
Reporting
-
Configuration
-
Trial and Demo
-
Monitoring Types
Adding Widgets (Graphical)
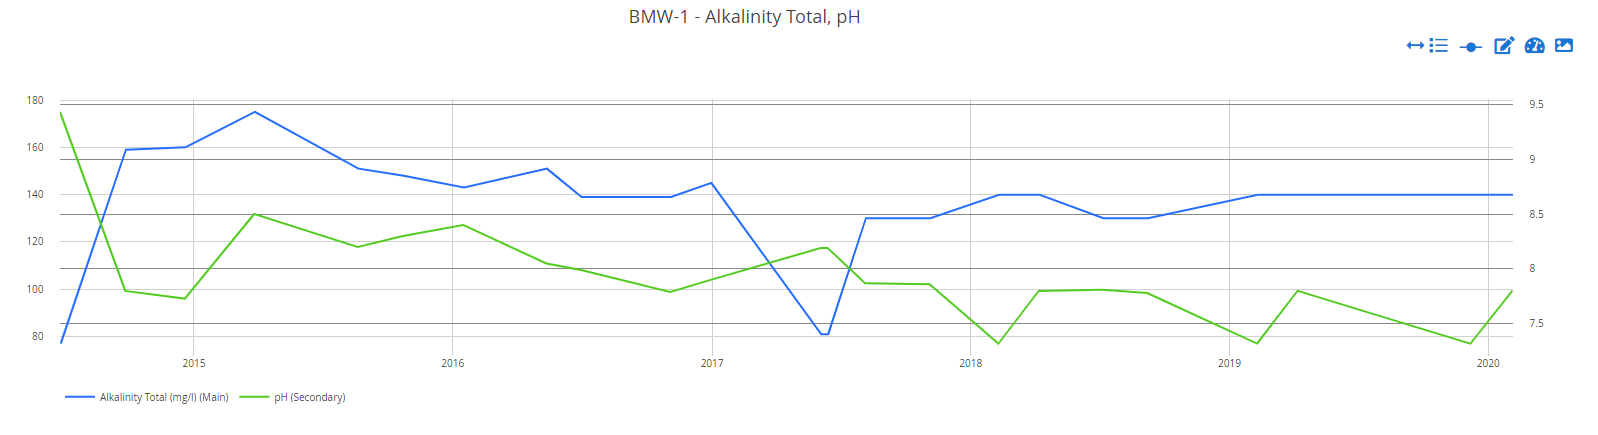
Adding Graphical Widgets to a Dashboard
Graphical Widgets can be added to a Dashboard from the Graphing Tab. Users can add a Pie, Bar, Combo, Wind Rose, or Line Graph including or excluding compliance limits. Simply follow the relevant section of the Manual to create your desired output and then use the Dashboard icon to add it.
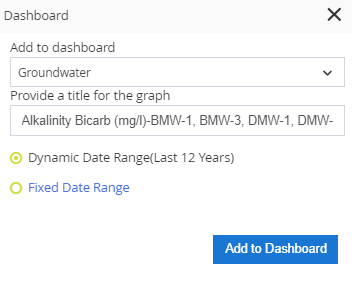
From here you can decide which Dashboard to add the Widget to and have the ability to rename the Widget from the default.
If the Dataset used to make the plot is Dynamic, you can choose to use this or make the date range fixed. Fixing the range will mean the Widget remains static with the selected date range. If Dynamic, the Widget will continue to update with the logic contained within the Dataset (or later changed).