- Knowledge Base and Manual
- MP-Desktop
- Introduction
-
Installation
-
Integration
-
MP-Desktop
-
MP-Web
- Introduction
- Access
- Side Bar Navigation
- Dashboard
- Favourites
- Datasets
- Summary Tab
- Tables Tab
- Export Tab
- Graphical Tab
- Report Tab
- Mapping Tab
- Manual Data Entry
- Calendar Tab
- Action Plans
- Custom Forms
- Contacts and Alerts
- Compliance
- Task Scheduler
- Monitoring Scheduler
- Calculator
- Data Entry
- Email Importer
- Object Management
- Obligations
- Policies
- Administration
- Administration - Manage Users
- Administration - Datasets
- Administration - Internationalisation
- Administration - Email Importer
- Administration - Monitoring
- Administration - Advanced
- Culture
-
MP-Field
-
Release Notes
-
Reporting
-
Configuration
-
Trial and Demo
-
Monitoring Types
MP-Desktop Outputs and Interpretation
Introduction to MP-Desktop Outputs and Interpretation
- Dataset system to query the database and save commonly used queries - provides simple double click outputs
- Dataset system supports rolling dates (both whole and last - e.g. last whole year or the last year from today)
- Data tables (summary, raw data, pivot table)
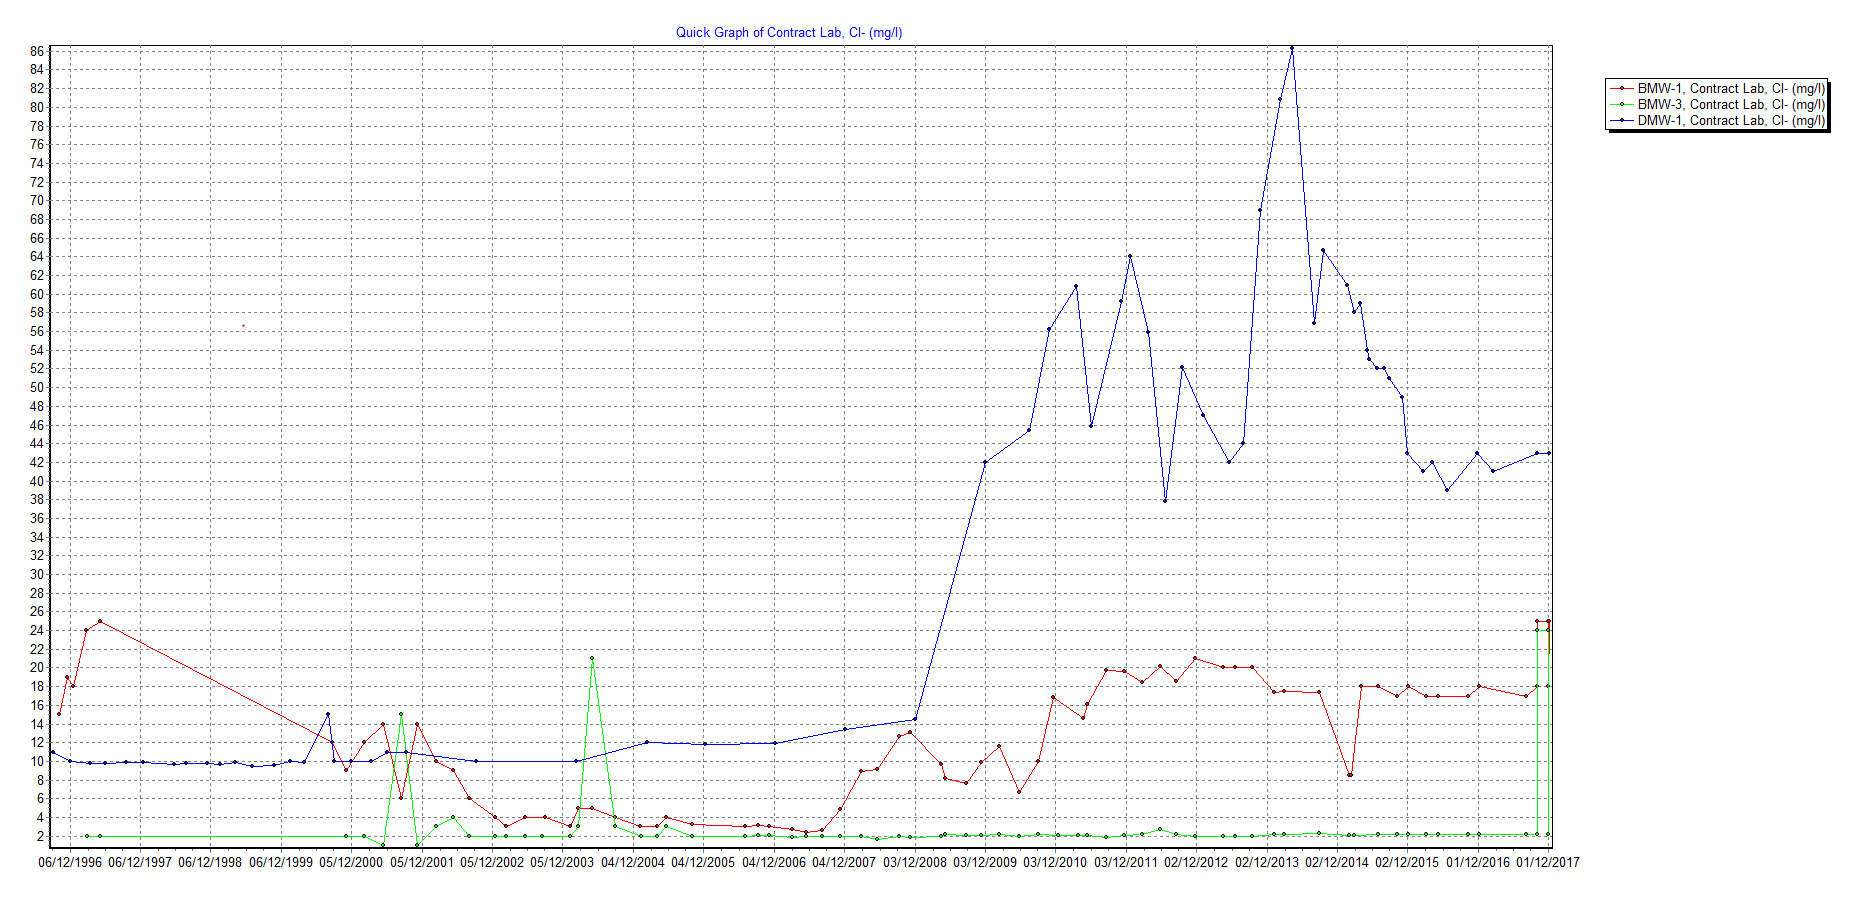
- Time series graphing (interactive) - (summary and raw data), full graph format and edit, save templates, trend lines, 2nd axis, compliance levels, etc
- Direct export from graph to Excel (with data), multiple options on export style and compliance level options)
- Pie charts
- Wind-rose with comparison to contaminant
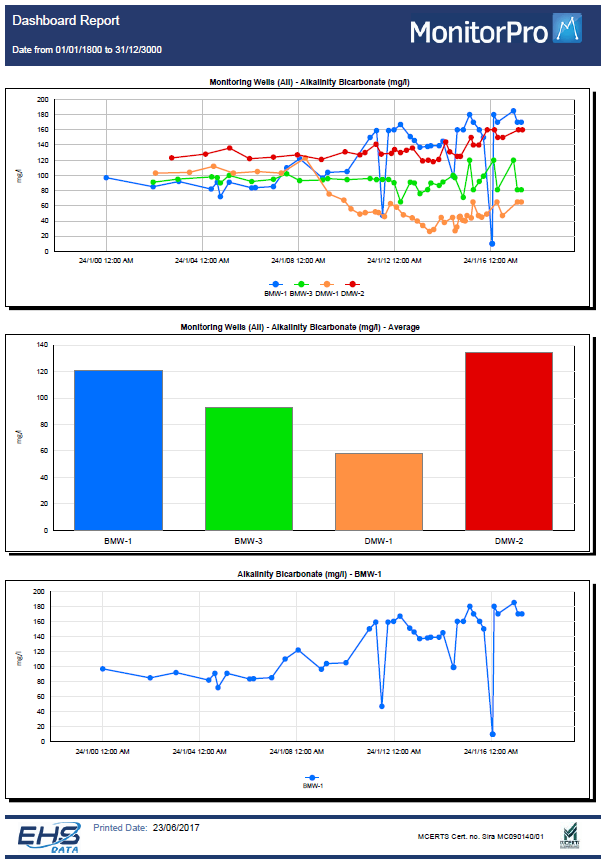
- Reporting - standard reports with the install (compliance, raw data, statistical summary report selection), reports customisable by user (Crystal Reports). Export options to Word, pdf, Excel, HTML, etc.
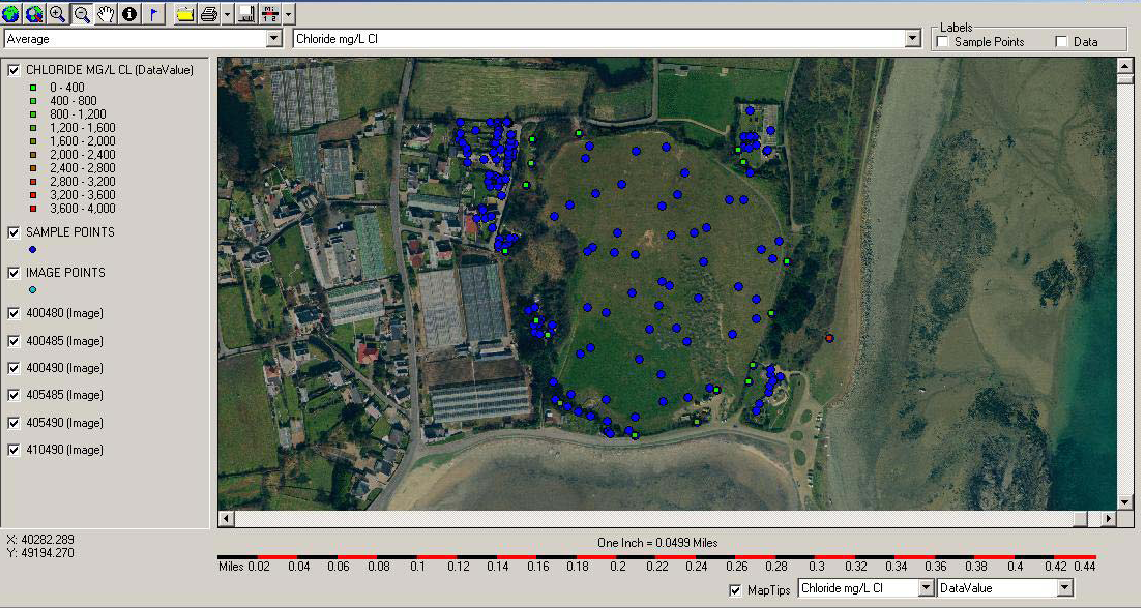
- Built-in mapping module and links to external mapping such as Google Earth. Supports geo-referenced raster (bmp, jpg, tiff), dxf, shp
- Displays selected sample points on map
- Thematics display information (min, max, average, count, count compliance breaches) as coloured dots
- MapInfo link opens MapInfo with map, selected locations and thematic toolbar.
- ESRI ArcMap connections
- Contouring output automatically creates 2D, 3D colour, and B&W contours direct to Surfer, (further customisation of the output can then be completed in Surfer).
Graphing
In-build Mapping
Reporting