How to produce Reports in MP-Desktop
Introduction
Reports are pre-formatted templates, either generic formats designed by EHS Data for clients, or customised to clients/industry requirements. Examples might be annual or quarterly reports, compliance reports or regulatory submission formats.
Most reports are Dataset based, that is the template contains the formatting but the data presented can be varied by the user. This might simply be changes in data over time (such as each quarter when the report is to be produced) or by adding or removing Objects to be included. The Dataset controls what data is included and the template how it is presented.
They can be exported to a variety of formats including Word, pdf, HTML and Excel. Word is handy for quarterly and annual reports where additional text often needs to be inserted.
Existing reports can be customised such as adding in logos or formatting changes. Also, additional reports can also be designed and added in. This can be done by the user, using the ‘Crystal Reports’ report editor. EHS Data provides a report design service as required.
Running Reports
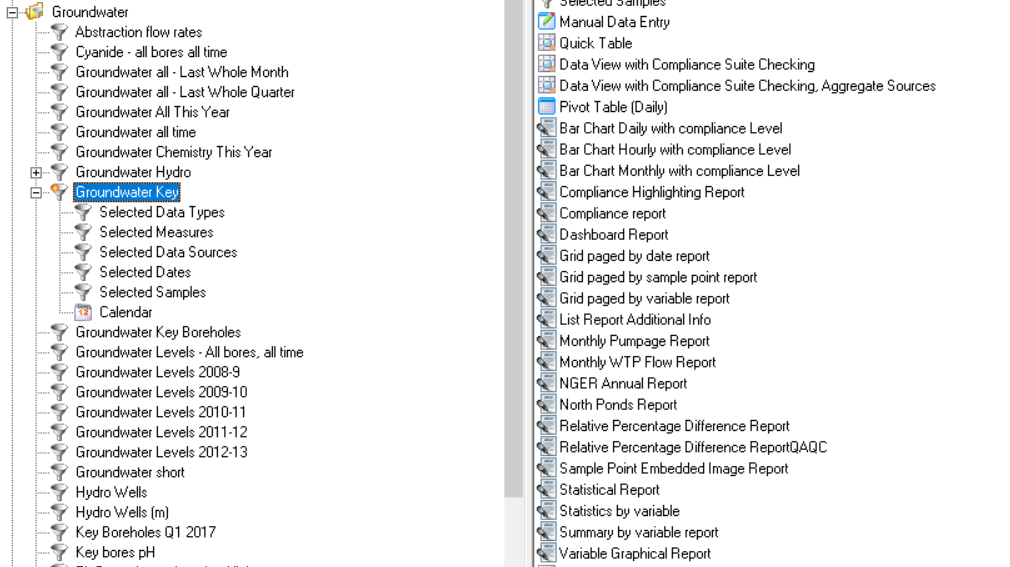
From any Dataset users will see the report templates available to them. Simply double-click on the report to generate the output.
The generated report will open in the Crystal Reports Viewer. From here the navigational tree can be used to navigate the reports output. This will vary depending upon the type of report and Dataset ran against.
Output
The Export Report icon is located at the top left of the tool bar. Click on this and choose the output type and location to save the report.
Note
The type of report and the way it has been constructed will affect its suitability to export to certain output types. All reports will export to pdf as expected. To Word, some objects may be presented as images (such as graphs). To Excel and CSV output is highly dependent on the underlying report structure.
Report Path and Naming
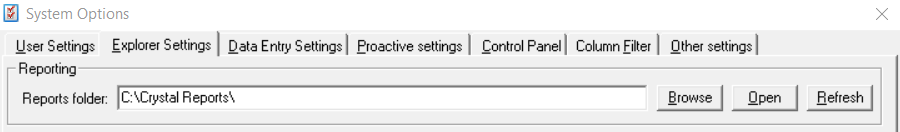
All report templates are run from a file with the extension .rpt. Where these report templates are saved is managed under System Options/Explorer Settings. By default, it will be the local path where MonitorPro has been installed. This path is saved within the user's .mei connection file and is specific to each database.
Tip
It's generally recommended that the report path be set to a shared location so all users can access the same set of reports.
If report templates are changed or users have a new report to include, these .rpt files need to be saved in the relevant reports folder. Once done, the folder needs to be refreshed using the button in System Options or MonitorPro needs to be closed and then opened again before the report will appear against a Dataset to run.
Report Server Settings
A server reports location can also be set up, which is where the automated report templates will be accessed from. This typically would be set up to be the same shared location as the user's access. To do so the correct folder permissions need to be applied so as the account which runs the MonitorPro Service can access them (this is ultimately the account which triggers the report generation at run time). The path needs to be the full server path, not a mapped drive.
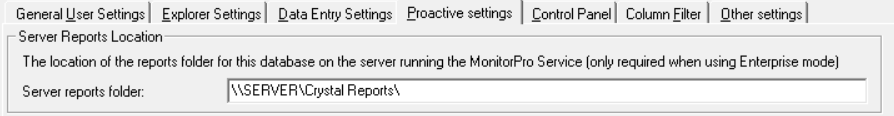
Note
This setting is saved in the database and used when in Enterprise mode (the MP-Service is connecting to a MonitorPro Gateway database) and not reading directly from a .mei file on the application server
Reports Types
Report templates should be suitably named to describe what they do to the users. After the name, a letter is used to instruct MonitorPro on how and where to display it, followed by a date.
o - This is used for Dataset report templates
s - This is used for Other report templates
v - This is used for Monitoring Schedule specific report templates
The date is used by MonitorPro for version control. If there are multiple reports with the same name, MonitorPro will use the one with the most recent date.
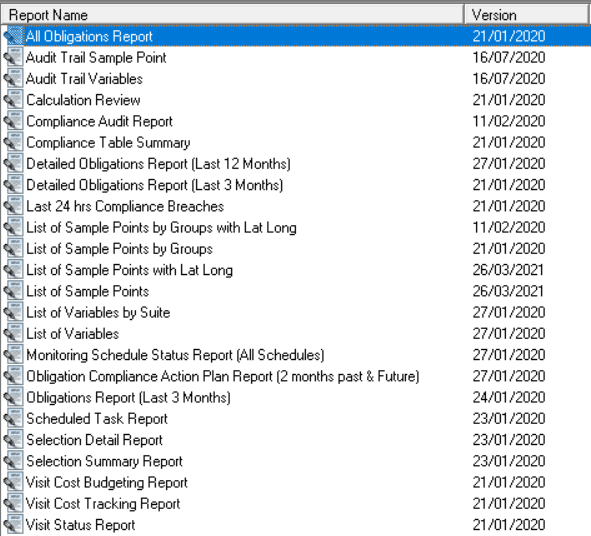
Other Reports
Unlike Dataset-based reports, Other Reports will show fixed amounts or types of data. They may contain inbuilt logic such as showing data for the last quarter, or data that has changed or is a breach for example. The logic though cannot be changed by the user.
They typically show objects, such as lists of Sample Points, or an audit trail of recent changes. They are accessed from the Control Panel/Other Reports.