
How to create Translation Grids in MP-Desktop
Introduction
Translation Grids can be accessed from Control Panel\Calculations\Translation Grids.
Translation Grids allow users to convert data from one format to another. This might be in the form of translating a number to text (or text to a number), such as Compass Points to Decimal Degrees, or converting data based on more complex logic such as a calculation.
If you open an existing Translation Grid, users can see the basic concepts where there will be an applicable location, then an input and output value.
Setup
Clicking on the Add New Translation Grid will open up a dialog to be completed.
Name - Provide a suitable name
Source Variable - This is the Variable where the data is coming from
Source Filter - Users can filter the Data Source of the incoming data, either to a specific Data Source or leave the data to be accepted from any Data Source.
Sample Type Filter - Users can filter the Sample Type of the incoming data, either to a specific Sample Type or leave the data to be accepted from any Data Source.
Destination Variable - This is the Variable where the data will go
Result Source - Users can set the Data Source of the outgoing data, either to a specific Data Source or leave the data to the Source of the incoming data.
Sample Type Filter - Users can set the Sample Type of the outgoing data, either to a specific Sample Type or leave the data to the Sample Type of the incoming data.
Modes
There are 4 modes that can be applied to the Translation Grids
Exact text matches - Here inbound data will be converted to the set translation, where that data's text is exactly matching the inbound requirements. The use case for this for example would be converting Compass Points to Decimal Degrees, 'S' = 180 degrees.
Linear Interpolation - With this mode, numeric input values are matched to the output values using linear interpolation. An example of this would be for calculating Stream Gauge flows using suitable rating curve data, input into the Translation Grid. In the below example an input value of 0.5m will produce an output of 10m3/h. An input value of 0.75m will create an output of 12.5m3/h.

Range Matching - In this mode, a numeric input value will produce either a numeric or text value where the value is equal to or less than the matching output. An example of this would be a Water Quality Index or any translation where you needed to create some text output from a value. In the below example a value of 3 - 3.9 would produce an output of 'Average'. You can equally use a numeric output for example converting a range of values to a differing scale of values. 0-10 = 1, 10-20 = 2 etc.

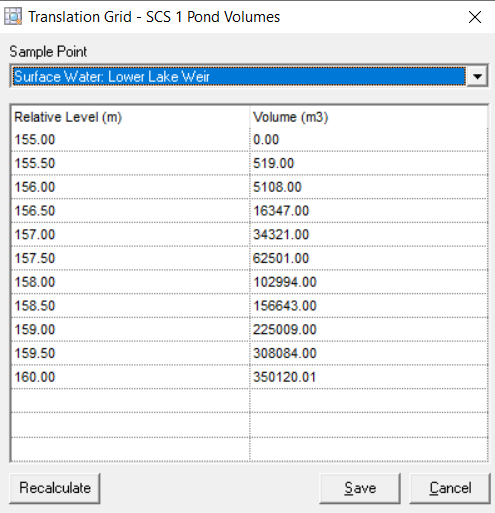
Cubic Spline Interpolation - This mode is very similar to the linear interpolation method but uses spline or cubic interpolation to match input to the output values. This is typical for ponds or water bodies with curved sides where interpolation between two references cannot simply be linear.
Location Type
The user has options as to how to apply the logic described above.
All Locations - This option will apply the Translation Grid to any location in MonitorPro where data for the chosen input Variable is located. This can be useful for generic translations applicable to a number of locations.
Per Location/Site/Monitoring Type - This option will apply the Translation Grid to a specific location in MonitorPro where data for the chosen input Variable is located. This can be useful for generic translations applicable to a number of Sample Points.
Per Sample Point Group - This option will apply the Translation Grid to a specific set of Sample Points located in a Sample Point Group, where data for the chosen input Variable is located. This can be useful for generic translations applicable to a number of Sample Points.
Individual Sample Points - This option will require a Translation Grid to be created for each individual Sample Point. This is the most common option when using Spline or Linear interpolation as each Sample Point will likely have a unique profile and rating curve.
Based on the option chosen the prompt will update providing either Locations, Sample Point Groups, or Sample Points as applicable. Choose the relevant objects by moving them from the left (unselected) to the right (selected).
Grid
Once saved the Grid can be populated as required. MonitorPro cannot create a rating curve for you, and this needs to be known to the user first. The more detailed the Grid the more accurate the results will be. For the two interpolation modes, MonitorPro will interpolate between the values based on one of the two methods selected. For the text matching the input data has to match exactly the text provided in the Grid for the translation to work.