- Knowledge Base and Manual
- MP-Web
- Tables Tab
-
Installation
-
Integration
-
MP-Desktop
-
MP-Web
- Introduction
- Access
- Side Bar Navigation
- Dashboard
- Favourites
- Datasets
- Summary Tab
- Tables Tab
- Export Tab
- Graphical Tab
- Report Tab
- Mapping Tab
- Manual Data Entry
- Calendar Tab
- Action Plans
- Custom Forms
- Contacts and Alerts
- Compliance
- Task Scheduler
- Monitoring Scheduler
- Calculator
- Data Entry
- Email Importer
- Object Management
- Obligations
- Policies
- Administration
- Administration - Manage Users
- Administration - Datasets
- Administration - Internationalisation
- Administration - Email Importer
- Administration - Monitoring
- Administration - Advanced
- Culture
-
MP-Field
-
Release Notes
-
Reporting
-
Configuration
-
Trial and Demo
-
Monitoring Types
MP-Web Output - Tables Tab (Pre v20)
MP-Web Tables Tab (Pre v20)
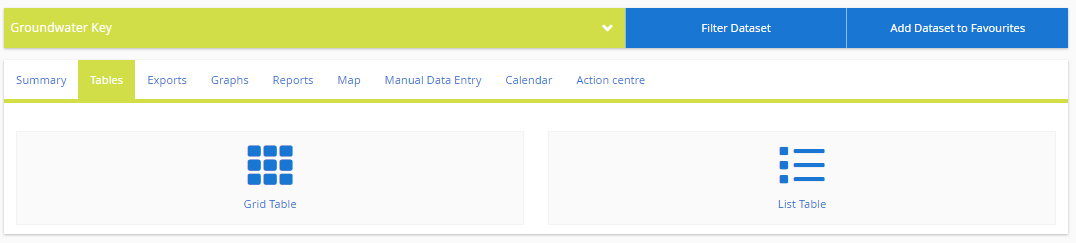
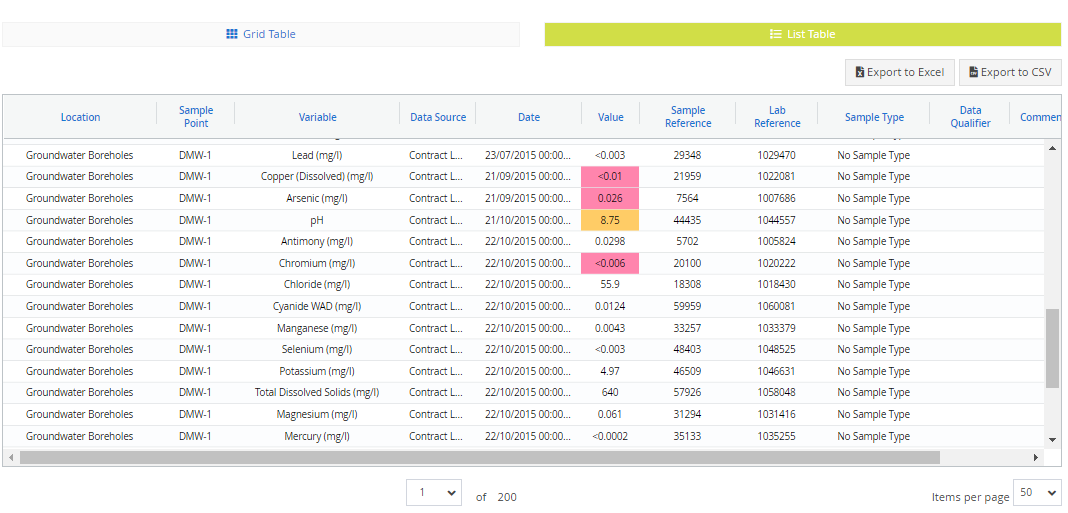
The Tables Tab allows users to see data quickly, in simple Grid and List layouts. Data is presented as either Grid (Variables listed along with the columns) or List (one column for data values). Each has ‘Export to Excel’ and 'Export to CSV' options.
Columns can be sorted by clicking on the column header, users can navigate between pages and set the number of rows per page. Data can be exported to .csv if required for further manipulation or submission to external stakeholders. Data exports use regional settings, for example, date format and decimal point/comma separator. Compliance breaches are highlighted and a key dynamically indicates the Level Type.
 By default, empty columns are suppressed. However, by unchecking the tick box, this can be turned off. By selecting the check box in the upper right-hand corner, data sources are aggregated.
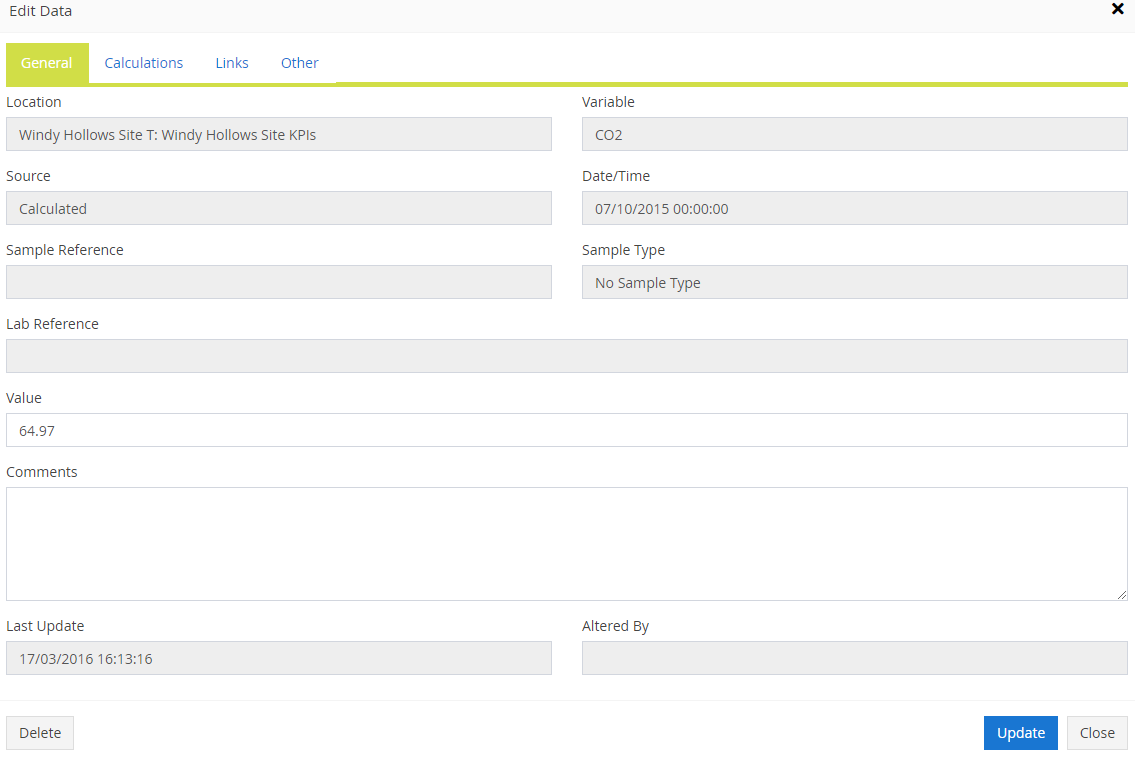
In List view, users with permissions to edit data will see an edit button. This will bring up the properties of the data point. Changes can be made and any linked documents can be accessed. A full audit trail of edits is recorded and previous histories can be reviewed.
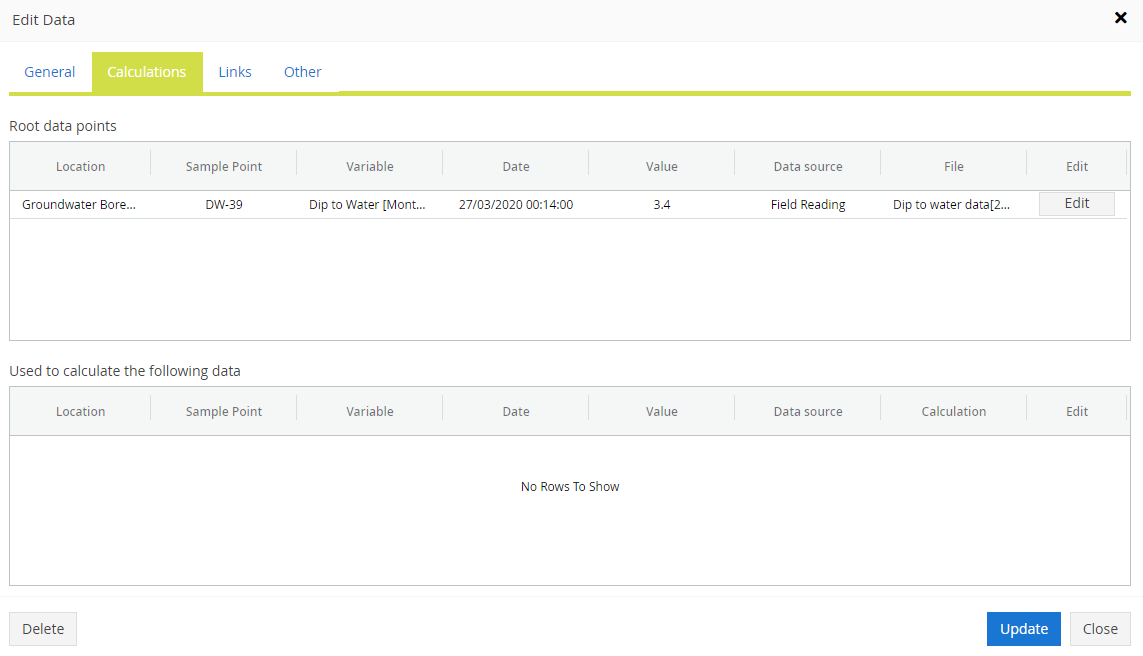
Users can see (where applicable) the data which made up a calculated value (if the data was calculated in MonitorPro). If a value was calculated the Calculations tab will detail the underlying or root data which was used to calculate the value being viewed. If this data record was then used to calculate further records it will be included in the second section of the tab.