
- Knowledge Base and Manual
- MP-Web
- Graphical Tab
-
Installation
-
Integration
-
MP-Desktop
-
MP-Web
- Introduction
- Access
- Side Bar Navigation
- Dashboard
- Favourites
- Datasets
- Summary Tab
- Tables Tab
- Export Tab
- Graphical Tab
- Report Tab
- Mapping Tab
- Manual Data Entry
- Calendar Tab
- Action Plans
- Custom Forms
- Contacts and Alerts
- Compliance
- Task Scheduler
- Monitoring Scheduler
- Calculator
- Data Entry
- Email Importer
- Object Management
- Obligations
- Policies
- Administration
- Administration - Manage Users
- Administration - Datasets
- Administration - Internationalisation
- Administration - Email Importer
- Administration - Monitoring
- Administration - Advanced
- Culture
-
MP-Field
-
Release Notes
-
Reporting
-
Configuration
-
Trial and Demo
-
Monitoring Types
MP-Web Output - Bar Chart Timeseries
MP-Web Bar Chart Timeseries
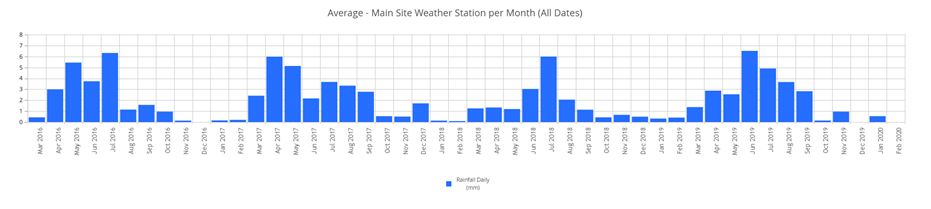
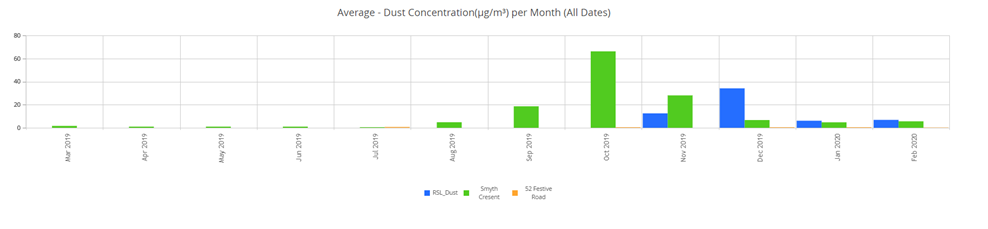
Time Series Bar Charts give users the ability to plot over time as a bar chart. This is useful to aggregate data over a period of time, such as rainfall, discharge volumes, or dust deposition.
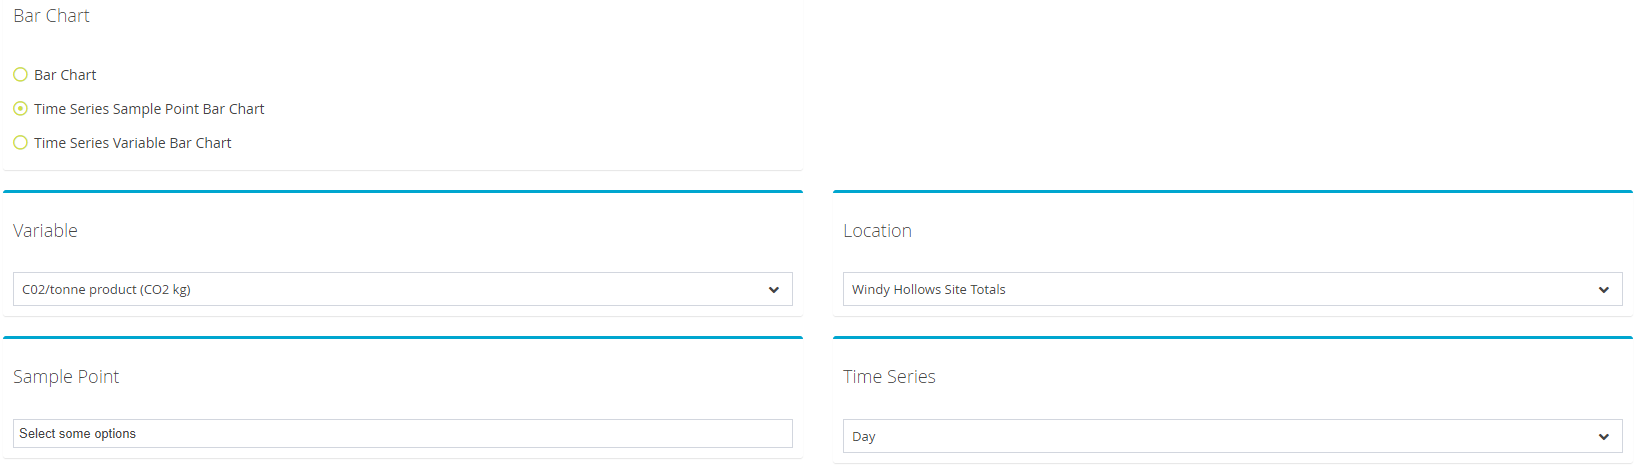
Users can choose to do this for multiple Variables or multiple Sample Points for comparison, then selecting the period of grouping, Hour, Day, Week, Month, Year. Using the Additional Setting Option you can also change the function, to which is default to Average.
If a warning is given regarding data volume select a less frequent summary period and try to produce the graph again or refine the selection of data.
