- Knowledge Base and Manual
- MP-Web
- Dashboard
-
Installation
-
Integration
-
MP-Desktop
-
MP-Web
- Introduction
- Access
- Side Bar Navigation
- Dashboard
- Favourites
- Datasets
- Summary Tab
- Tables Tab
- Export Tab
- Graphical Tab
- Report Tab
- Mapping Tab
- Manual Data Entry
- Calendar Tab
- Action Plans
- Custom Forms
- Contacts and Alerts
- Compliance
- Task Scheduler
- Monitoring Scheduler
- Calculator
- Data Entry
- Email Importer
- Object Management
- Obligations
- Policies
- Administration
- Administration - Manage Users
- Administration - Datasets
- Administration - Internationalisation
- Administration - Email Importer
- Administration - Monitoring
- Administration - Advanced
- Culture
-
MP-Field
-
Release Notes
-
Reporting
-
Configuration
-
Trial and Demo
-
Monitoring Types
Widgets (Graphical Summary)
Graphical Summary Widgets
Line Plots added as Graphical Widgets can be updated to show summaries of the base data. They can be set with a particular summary when created before being added to the Dashboard or updated when on the Dashboard.
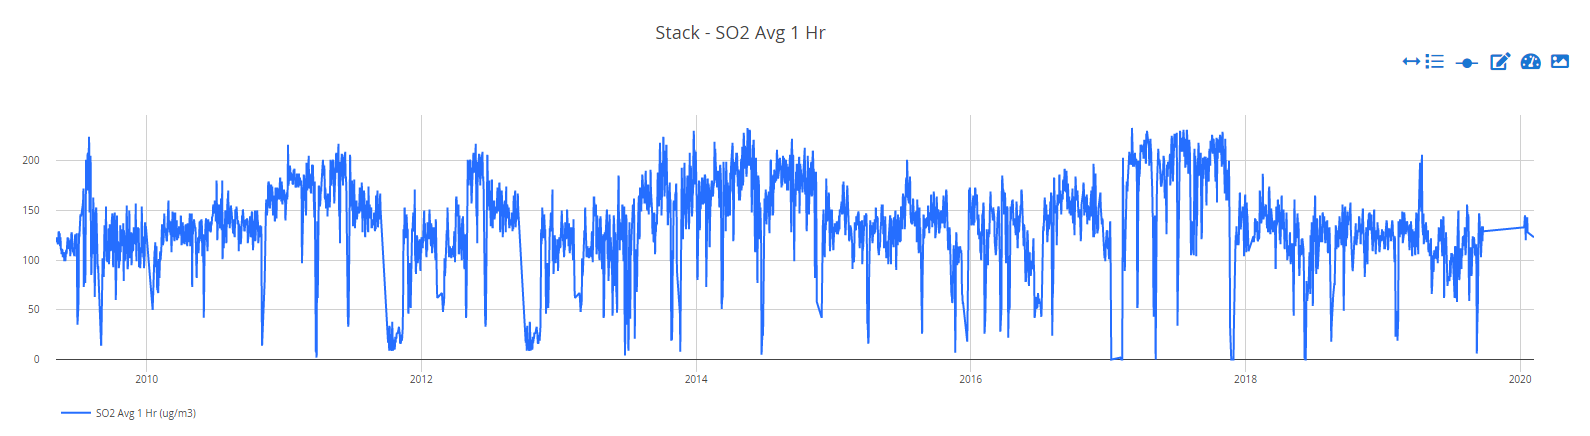
The example below is of a Line Plot including some high-frequency data recorded half-hourly. To summarise this data click on the edit Dashboard and then click on the edit icon which will display in the top right-hand corner of the plot. This will open the Widget Settings.
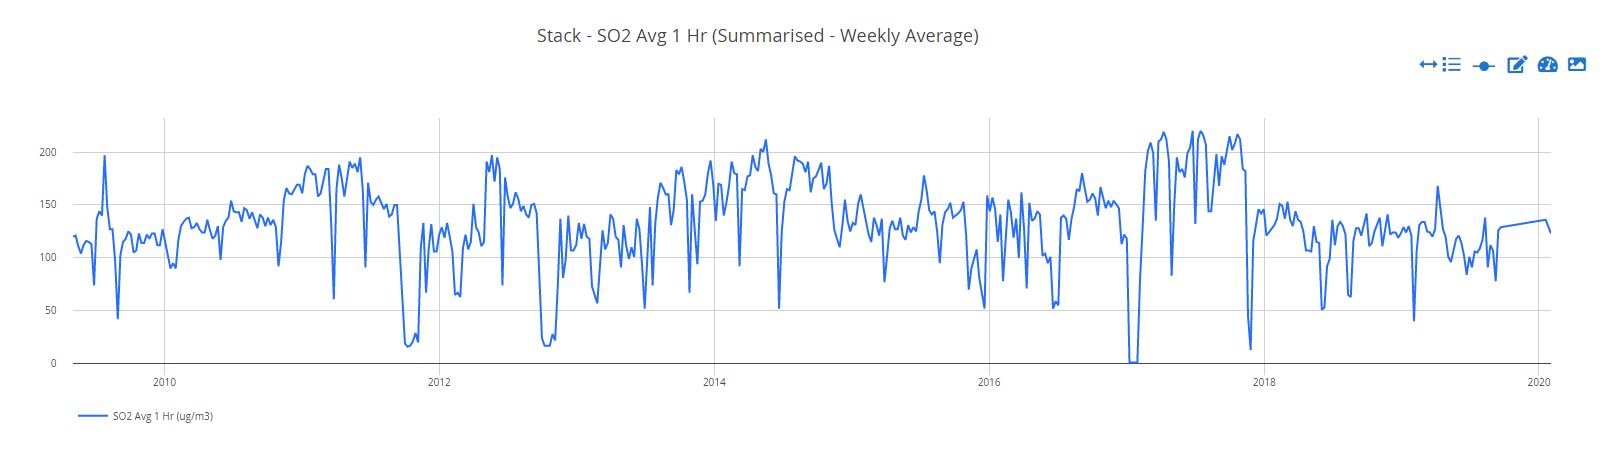
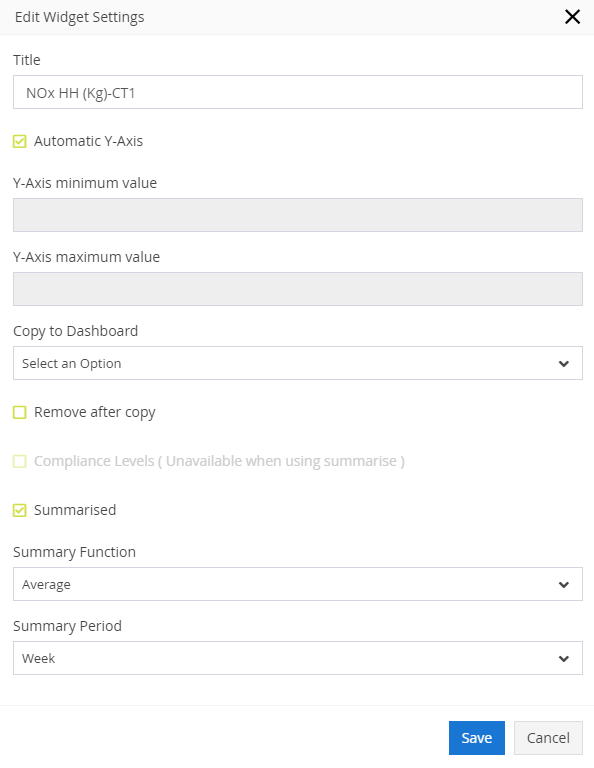
Tick the summarised option to open up the options. Select the summary function required and the summary period as the below example.
The plot will then update to the summary set. If you want to save the changes then click the 'I'm done' option at the top of the Dashboard. You can change the plots as many times as required.