- Knowledge Base and Manual
- MP-Desktop
- Database Explorer
-
Installation
-
Integration
-
MP-Desktop
-
MP-Web
- Introduction
- Access
- Side Bar Navigation
- Dashboard
- Favourites
- Datasets
- Summary Tab
- Tables Tab
- Export Tab
- Graphical Tab
- Report Tab
- Mapping Tab
- Manual Data Entry
- Calendar Tab
- Action Plans
- Custom Forms
- Contacts and Alerts
- Compliance
- Task Scheduler
- Monitoring Scheduler
- Calculator
- Data Entry
- Email Importer
- Object Management
- Obligations
- Policies
- Administration
- Administration - Manage Users
- Administration - Datasets
- Administration - Internationalisation
- Administration - Email Importer
- Administration - Monitoring
- Administration - Advanced
- Culture
-
MP-Field
-
Release Notes
-
Reporting
-
Configuration
-
Trial and Demo
-
Monitoring Types
MP-Desktop Database Explorer
Introduction to the MP-Desktop Database Explorer
Explorer

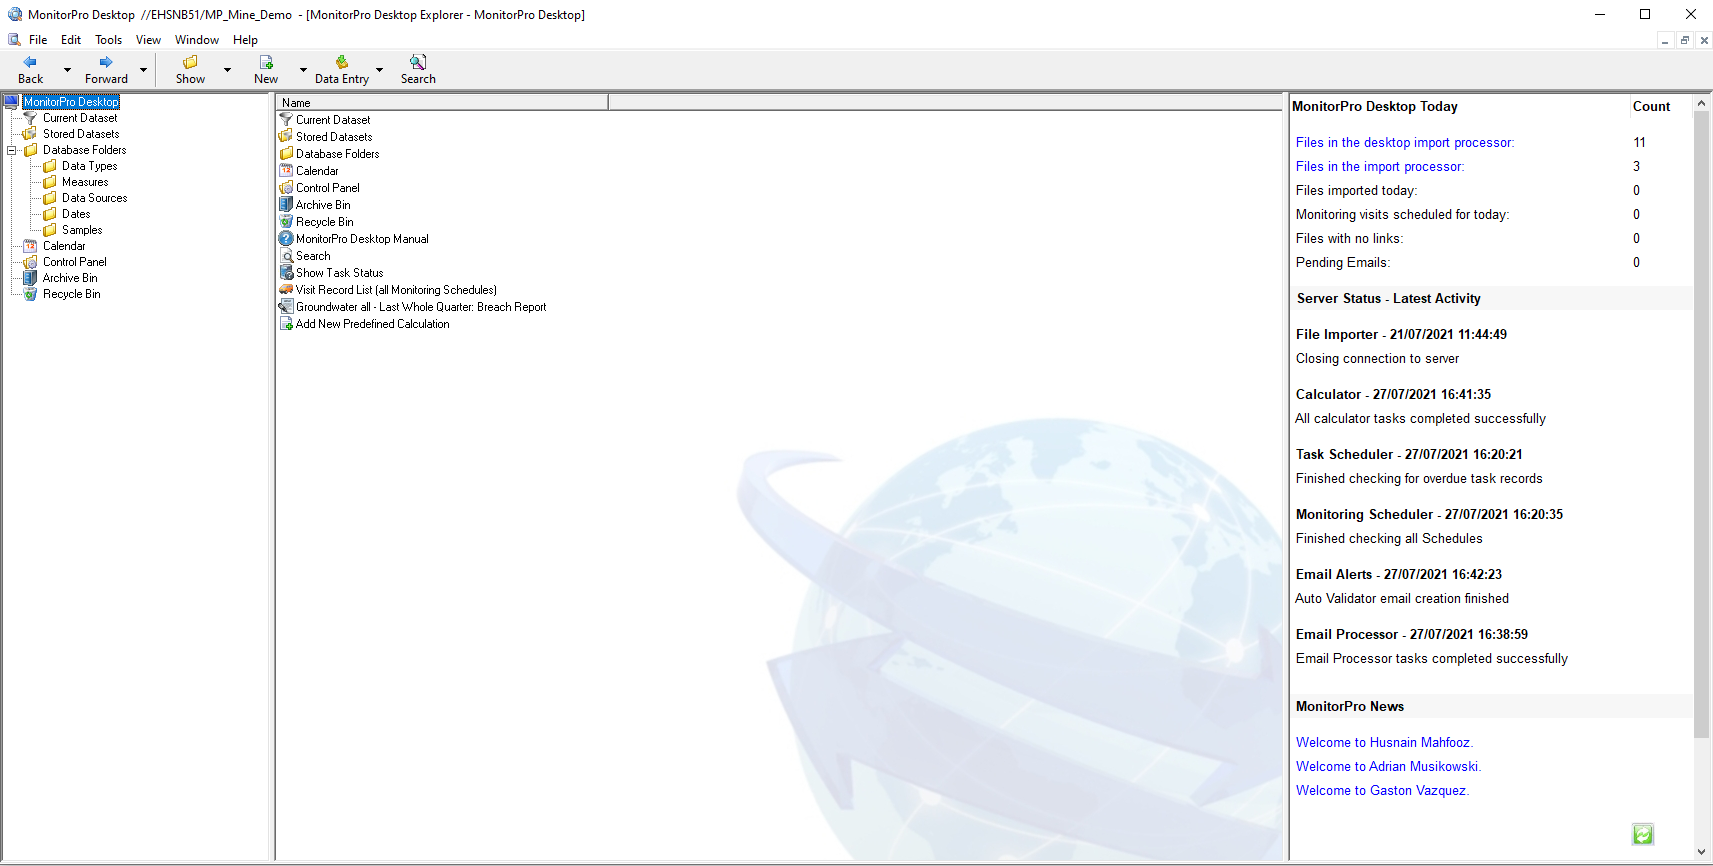
Upon successfully logging in to MonitorPro Desktop, three elements of the database explorer will be visible:
- The database tree shows the structure of the database and allows navigation to the desired area
- The MonitorPro Desktop is a space where shortcuts to regularly used functions can be held
- MonitorPro Desktop Today gives an overview of the monitoring schedule and importer on the day in question. It also displays recent news from the EHS Data website.
- The Server Status provides the user with information of the current automated routines running on the Server, such as the Calculator, Task Scheduler, Monitoring Scheduler, Email Alerts, and File Importer
- The database explorer can be used to drill down to any object to view summary data, raw data and produce graphs:
Data Type/Location
Sample Point
Variable
Data source
Date
Samples
Graphs from the explorer automatically go to the summary mode for large data sets (e.g. monthly min, max, average) with drill down to monthly data and graphs.
Grouping system to place similar Sample Points together, and similar variables into 'suites' for ease of selection and viewing.
