
- Knowledge Base and Manual
- MP-Web
- Graphical Tab
-
Installation
-
Integration
-
MP-Desktop
-
MP-Web
- Introduction
- Access
- Side Bar Navigation
- Dashboard
- Favourites
- Datasets
- Summary Tab
- Tables Tab
- Export Tab
- Graphical Tab
- Report Tab
- Mapping Tab
- Manual Data Entry
- Calendar Tab
- Action Plans
- Custom Forms
- Contacts and Alerts
- Compliance
- Task Scheduler
- Monitoring Scheduler
- Calculator
- Data Entry
- Email Importer
- Object Management
- Obligations
- Policies
- Administration
- Administration - Manage Users
- Administration - Datasets
- Administration - Internationalisation
- Administration - Email Importer
- Administration - Monitoring
- Administration - Advanced
- Culture
-
MP-Field
-
Release Notes
-
Reporting
-
Configuration
-
Trial and Demo
-
Monitoring Types
MP-Web Output - Bar Charts
MP-Web Bar Charts
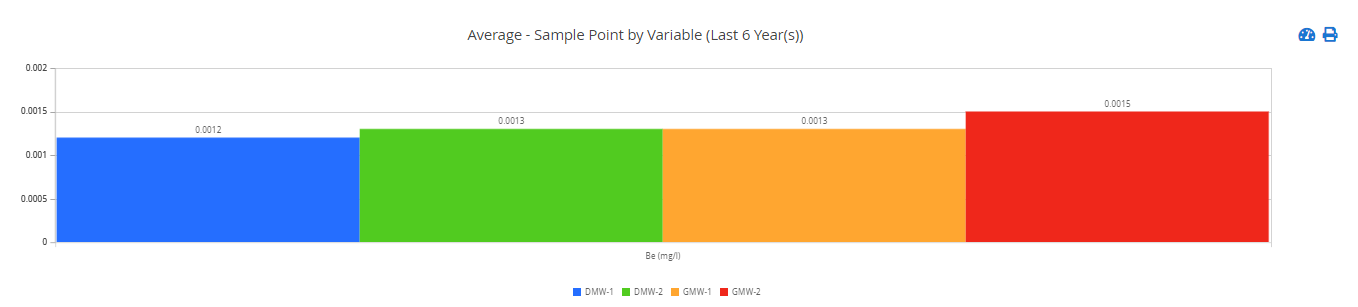
Bar charts can be configured in multiple ways. The default chart is a Sample Point by Variable chart and is simply created by choosing the Sample Points and Variables to plot, then clicking the Draw Graph button.
Single Variable Multi-Sample Point
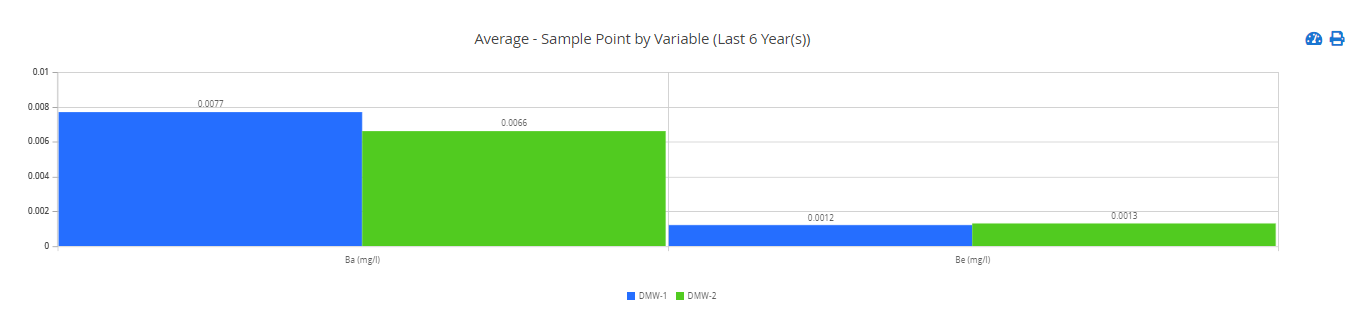
Multi-Sample Point and Variable
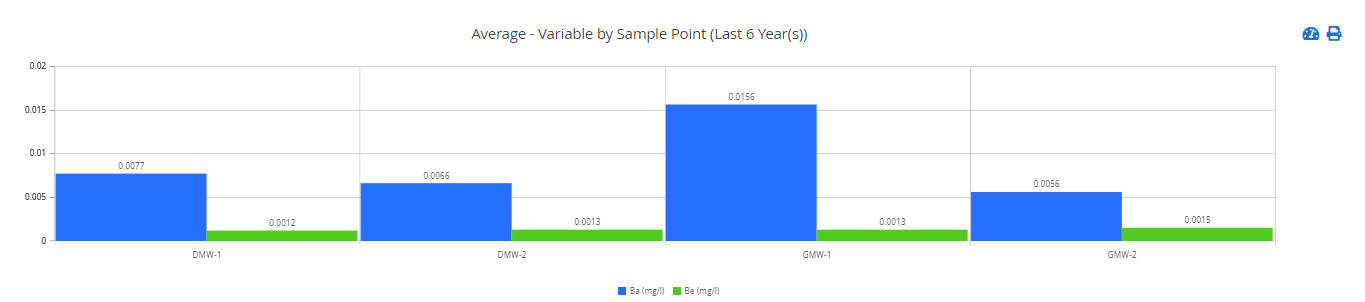
To change the configuration of the plot, click the ‘Show Additional Options’ link and change the X-Axis Grouping and Data Series settings. For example, to produce a Variable by Sample Point chart you would change the X-Axis Grouping to Sample Point and the Data Series to Variable.
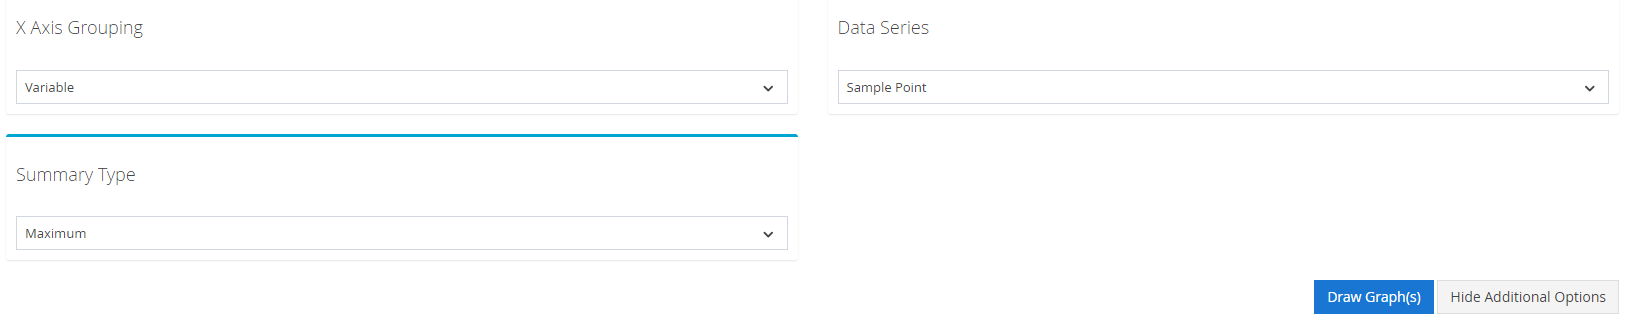
Users can equally change the summary type from Average (the default) to Min, Max, or Count.