How to create Translation Grids in MonitorPro
Translation Grid Example 1: Stream Gauge
Direct measurement of streamflow is difficult, and surrogate methods are often used. One method is to construct a 'rating curve'.
A rating curve is a functional relation between stage and discharge. It is determined by making repeated discrete measurements of streamflow discharge using a velocimeter and some means to measure the channel geometry to determine the cross-sectional area of the channel. The technicians and hydrologists responsible for determining the rating curve visit the site routinely, with special trips to measure the hydrologic extremes (floods and droughts) and make a discharge measurement by following an explicit set of instructions.
Once the rating curve is established, it can be used in conjunction with stage (height or depth) measurements to determine the volumetric streamflow discharge. This record then serves as an assessment of the volume of water that passes by the stream gauge and is useful for many tasks associated with hydrology.
The resultant curve states therefore that for any given depth of water, a corresponding discharge rate or flow applies.
The depth reading will often not correspond to an exact depth on a rating curve, and interpolation between the nearest two is necessary.
Setup the Translation Grid as per the full setup details. Choose the Linear Interpolation mode, and then enter the rating curve into the Translation Grid. Where staff measurements are then provided in between these depths interpolation will conclude the correct flow based on linear interpolation between the values.

Translation Grid Example 2: Pond Volumes
In a similar way to establishing flows from a depth measurement at a weir, a Translation Grid can be used to establish Pond Volumes. Typically engineers or surveyors will be able to provide a profile of the pond/lagoon/dam, calculating the volume at known depths. A Translation Grid can then be set up using this information to automatically calculate the pond volume at certain recorded depths.
Users can choose to set up their Translation Grid either using Linear or Spline interpolation. Linear Interpolation infers a straight-line transition from point to point whereas Spline interpolation uses a formula to establish a smoother curve of the pond.
Set up the Translation Grid as per the full setup details. Choose the Linear interpolation mode or Spline interpolation, and then enter the rating curve into the Translation Grid. Where depth measurements are then provided in between these depths interpolation will conclude the correct volume.
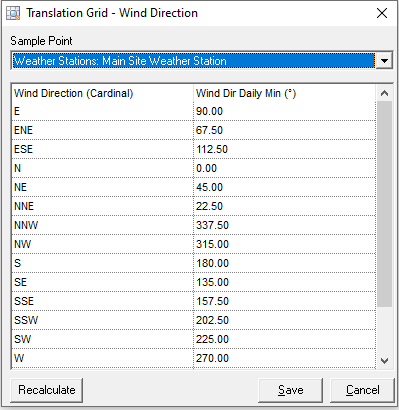
Translation Grid Example 3: Compass/Cardinal to Degrees Wind Direction
Some weather stations will output wind direction in a compass direction, and these need to be converted to decimal degrees to enable the use of the data in a wind rose. This process is also required if you wish to aggregate the data for example daily or monthly. In this example, the incoming text will convert to the applicable degrees.