
- Knowledge Base and Manual
- MP-Web
- Graphical Tab
-
Installation
-
Integration
-
MP-Desktop
-
MP-Web
- Introduction
- Access
- Side Bar Navigation
- Dashboard
- Favourites
- Datasets
- Summary Tab
- Tables Tab
- Export Tab
- Graphical Tab
- Report Tab
- Mapping Tab
- Manual Data Entry
- Calendar Tab
- Action Plans
- Custom Forms
- Contacts and Alerts
- Compliance
- Task Scheduler
- Monitoring Scheduler
- Calculator
- Data Entry
- Email Importer
- Object Management
- Obligations
- Policies
- Administration
- Administration - Manage Users
- Administration - Datasets
- Administration - Internationalisation
- Administration - Email Importer
- Administration - Monitoring
- Administration - Advanced
- Culture
-
MP-Field
-
Release Notes
-
Reporting
-
Configuration
-
Trial and Demo
-
Monitoring Types
MP-Web Output - Line Graphs
MP-Web Line Graphs
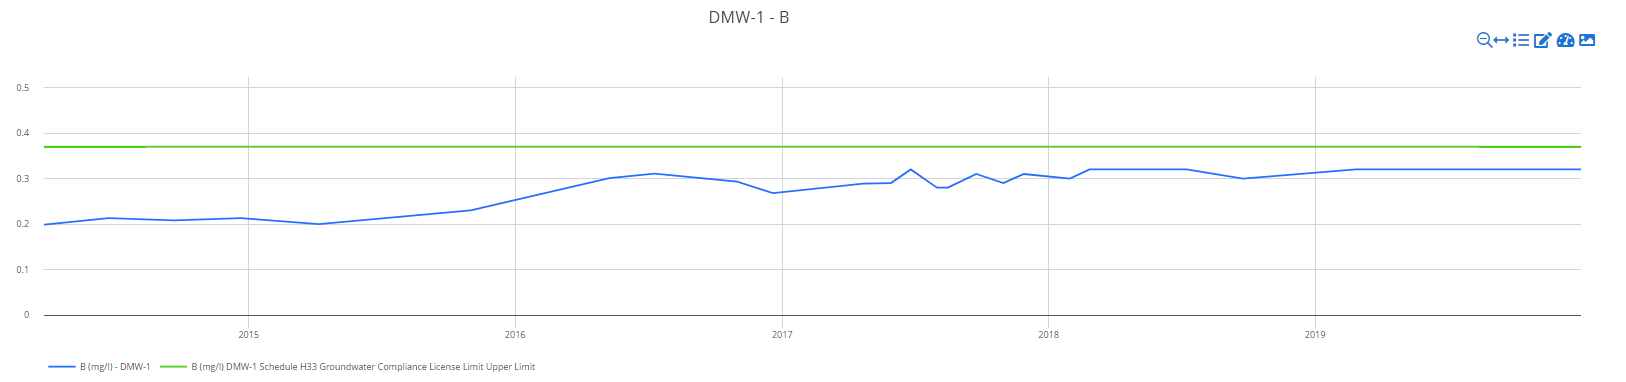
There are four options for plotting line graphs. The default option ‘Graph all Variables (one graph per Variable)’ will create a plot for each of the Variables associated with the chosen Location and Sample Point. This option also gives the choice of displaying compliance limits (where applicable) on each plot.
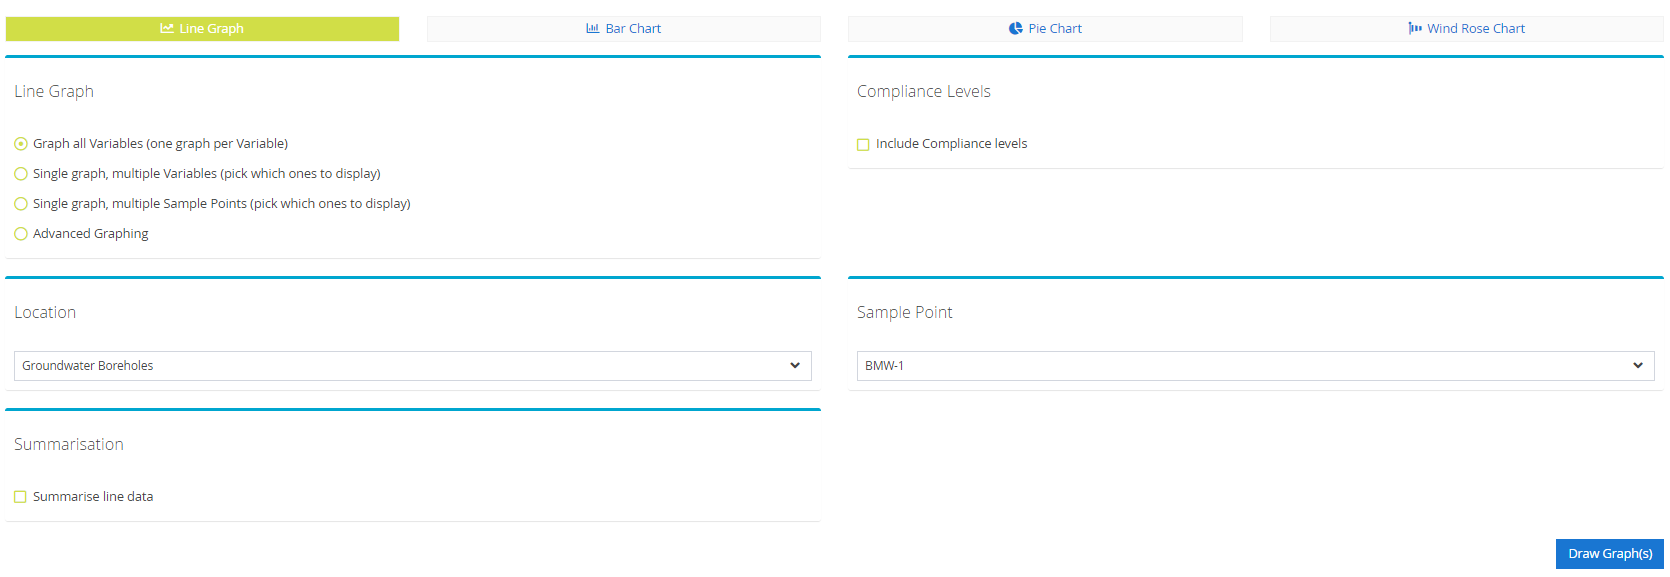
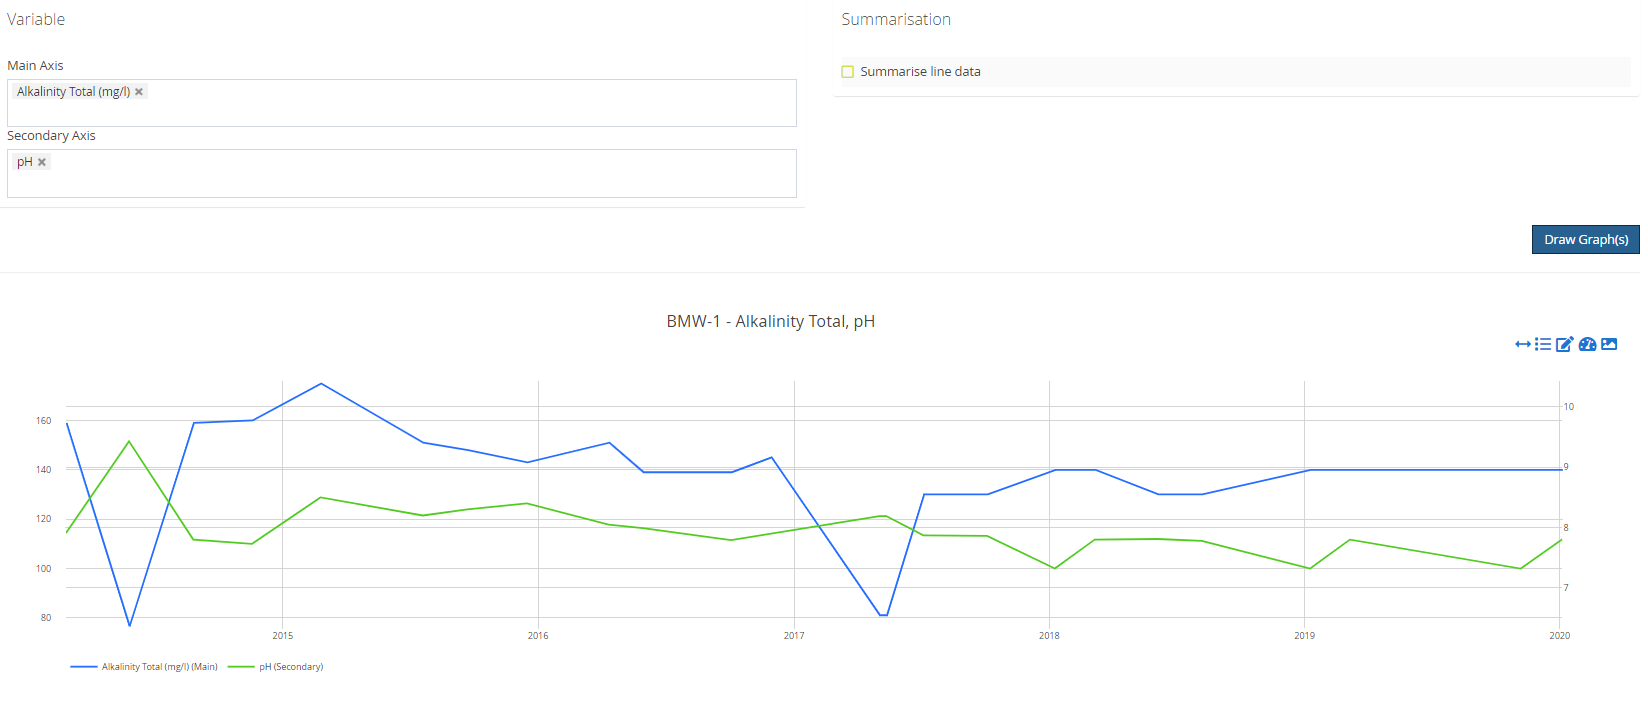
The second option ‘Single graph, multiple Variables (pick which ones to display)’ produces a single plot containing multiple Variables. Only Variables containing data for the selected Location and Sample Point are shown in the list. You can choose to have all your Variables listed on the primary axis or a combination across the primary and secondary axis.
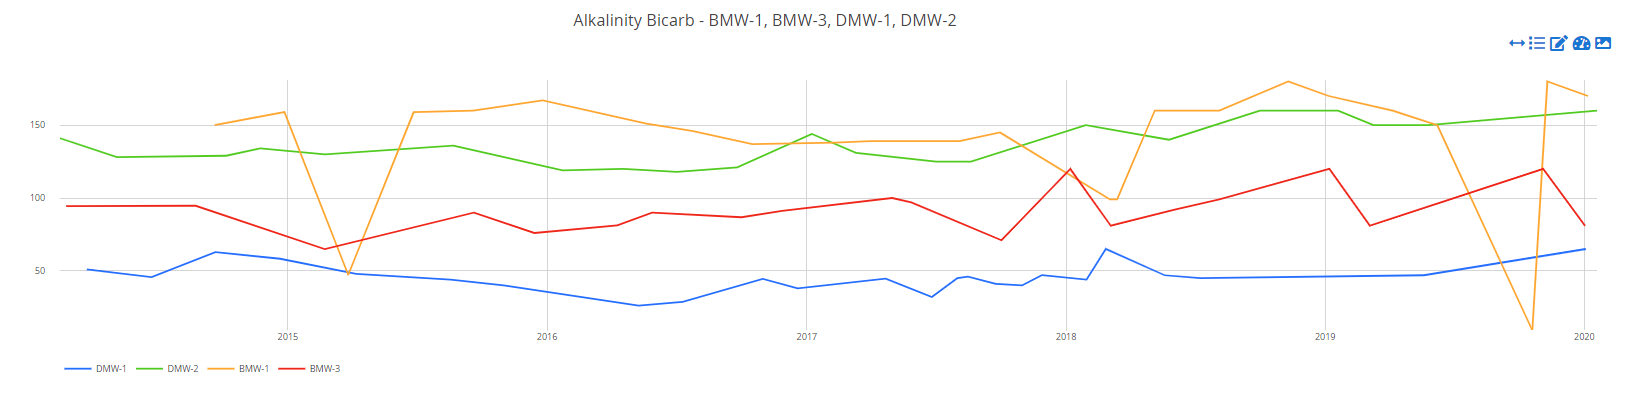
The third option ‘Single graph, multiple Sample Points (pick which ones to display)’ produces a single plot containing multiple Sample Points. Only Sample Points containing data for the selected Variable are shown in the list. Again if required different Sample Points can be added to a primary or secondary axis.
Advanced Graphing will give the user all the options allowing for example a combination of multiple Sample Points and multiple Variables.
For further refinement of the line graphing see the following: