
MP-Web Mapping
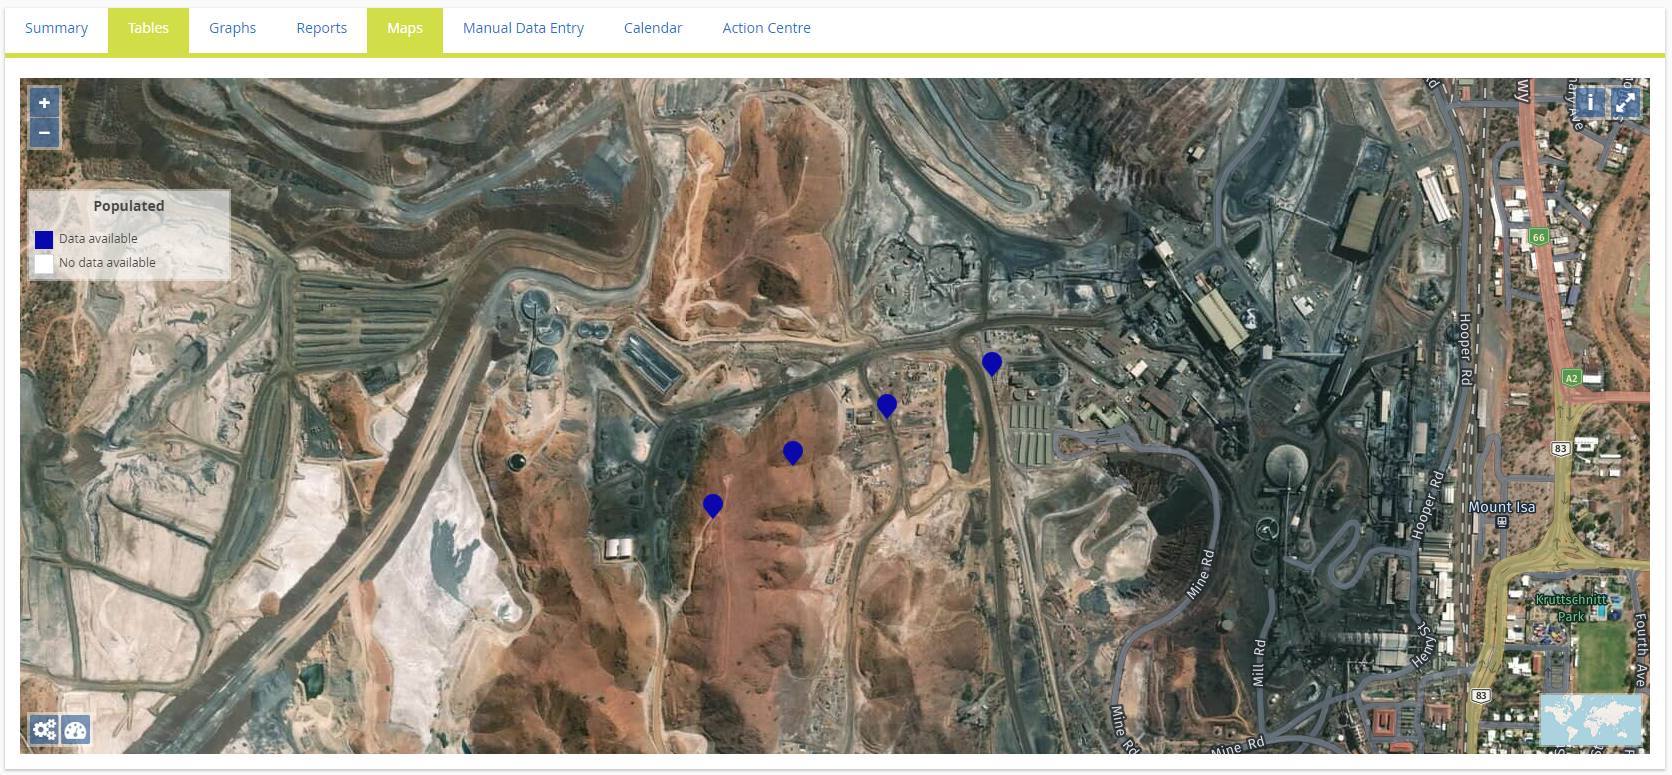
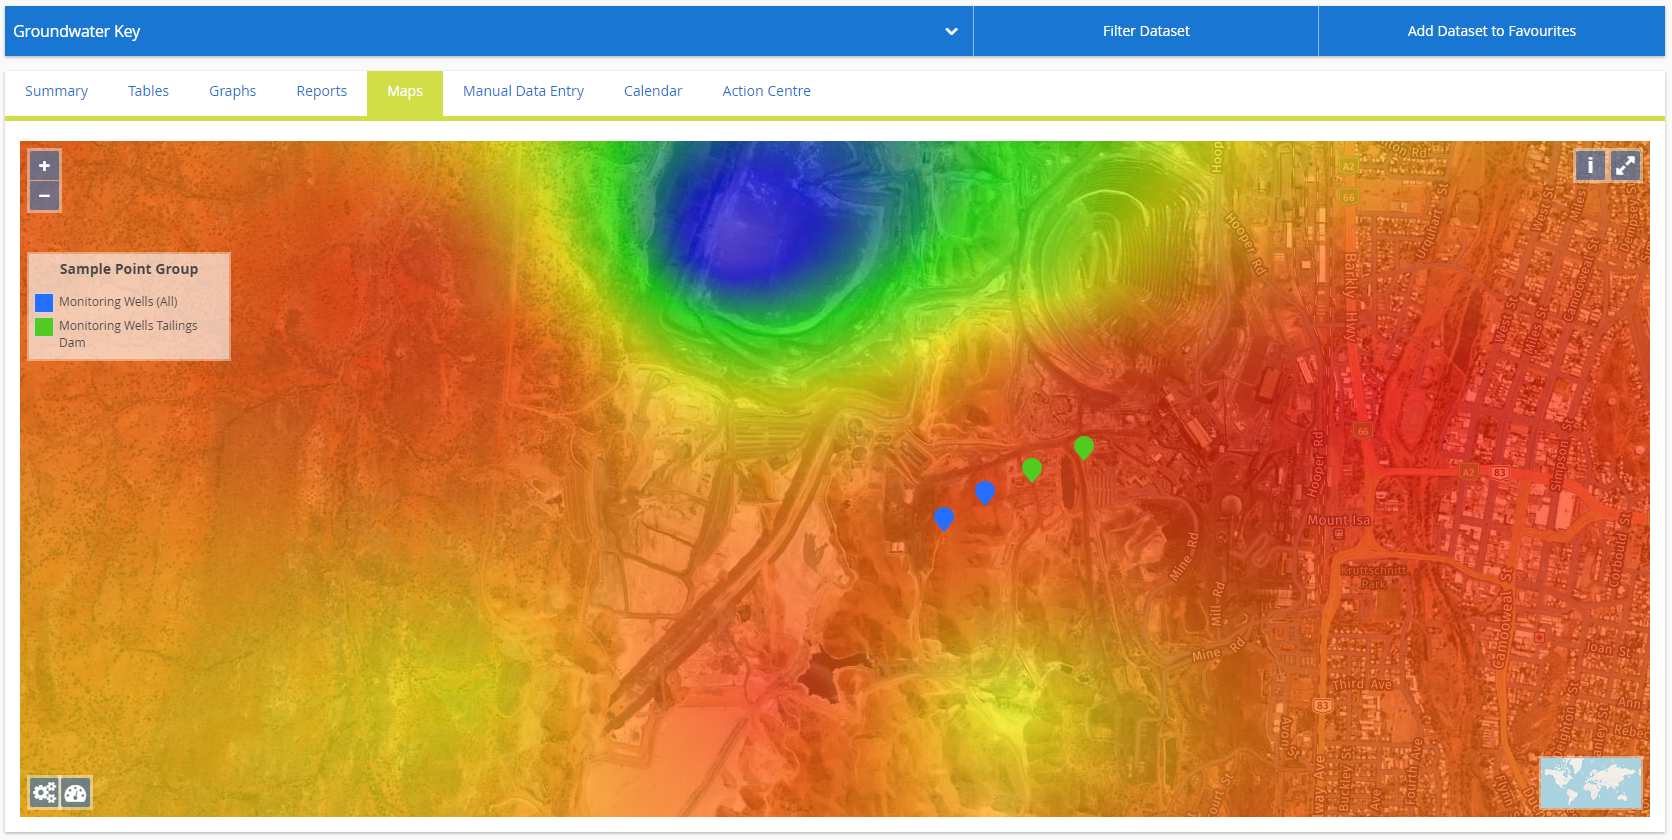
If the Dataset being used contains Sample Points with coordinates, the map will load and centre to those locations.
Coordinates
Sample Points will be displayed if a compatible coordinate system (decimal lat/long or WGS 84) is populated within the database Sample Point Properties (also see below section on using secondary or primary coordinates).
Sample Point Data - Tables
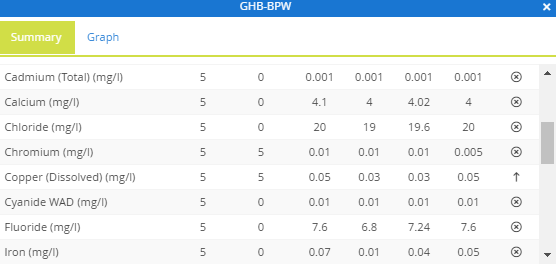
All Sample Points with data will be displayed with blue pins and any without white. Clicking on any Sample Point will display a summary table of data. This will give a summary of the data available within the Dataset for that Sample Point, the number of readings, any breaches, the min, max, average, the last reading, and a trend summary is all displayed.
Sample Point Data - Graphing
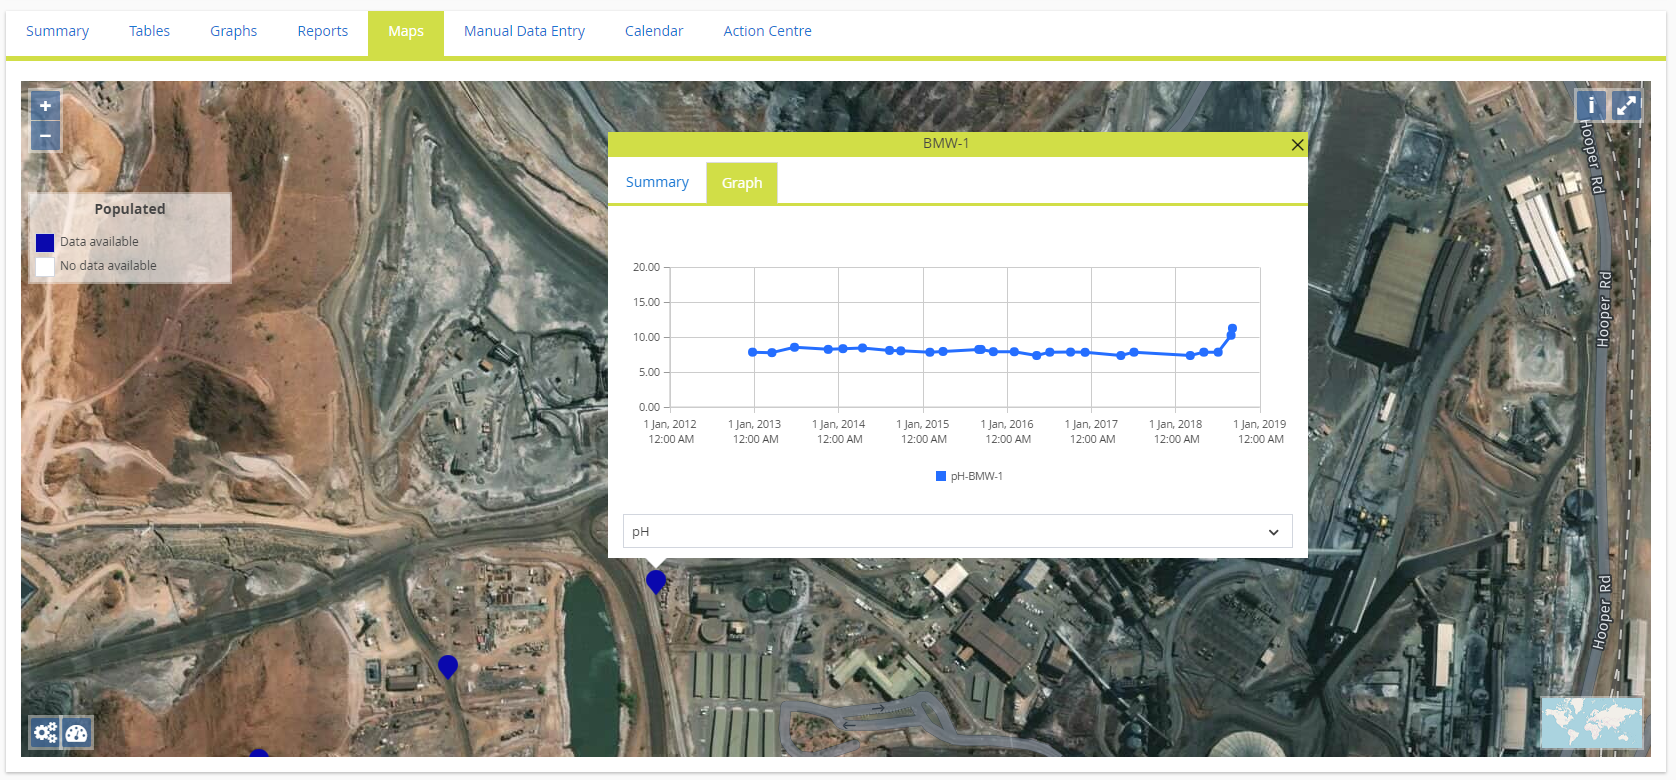
By clicking on the Graph tab you can plot the data within the Dataset from the map. First, click on the Graph tab and choose the Variable you would like to plot from the drop-down list (this is filtered to those Variables within the Dataset chosen). Once chosen the Graph will plot, along with any associated compliance which has been set up for that Variable and Sample Point. If you close the window and click on another Sample Point it will jump directly to the Graphing tab and plot the same Variable as previously chosen. If this isn't desired, simply choose another Variable. If you wish to expand the date range or include other Sample Points or Variables, do so from the Filter Dataset menu.
HERE Maps - https://wego.here.com
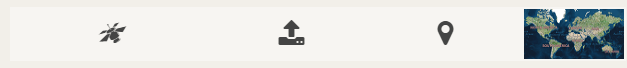
HERE Maps is utilised to display high-resolution Satellite imagery. This will be on by default when your locations load. To toggle this off and display a base image indicating roads and other structures, then click the world map icon in the bottom right corner. Repeat to turn the Satellite image back on.
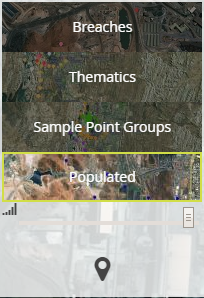
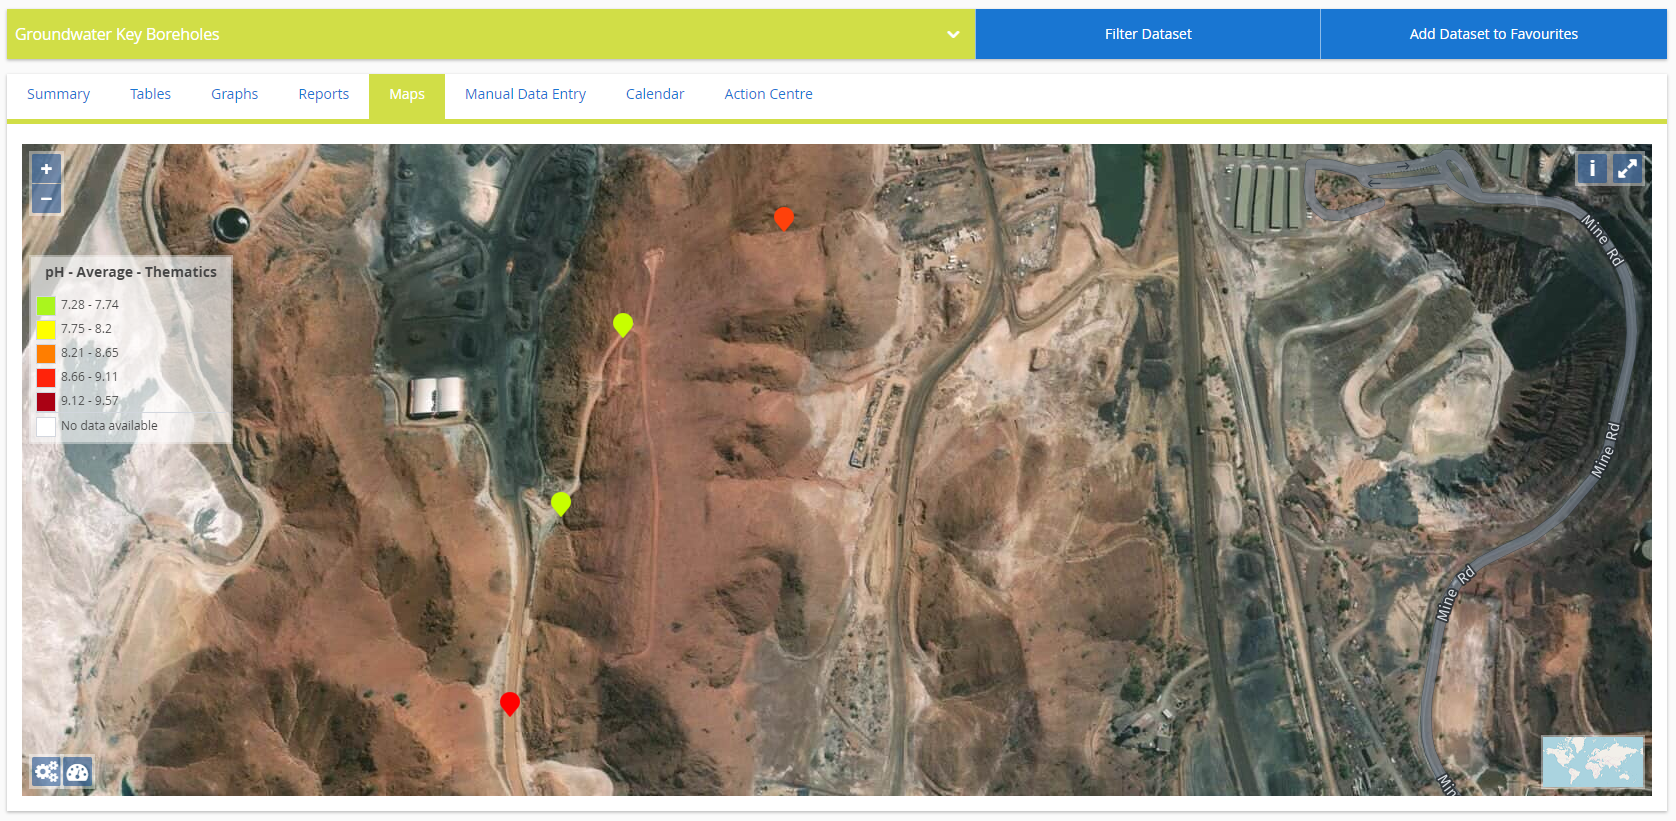
Thematics
Within the Sample Point menu, there are a number of options to display the data associated with the Sample Points.
The Thematics option enables you to view the concentration of a particular Variable in comparison to the Sample Points within the chosen Dataset. First, choose the Thematics option from the menu. Then select the Variable you would like to analyse. MP-Web will automatically group the data into 5 categories and colour the pins accordingly. This enables you to observe where the high and low concentrations are located.
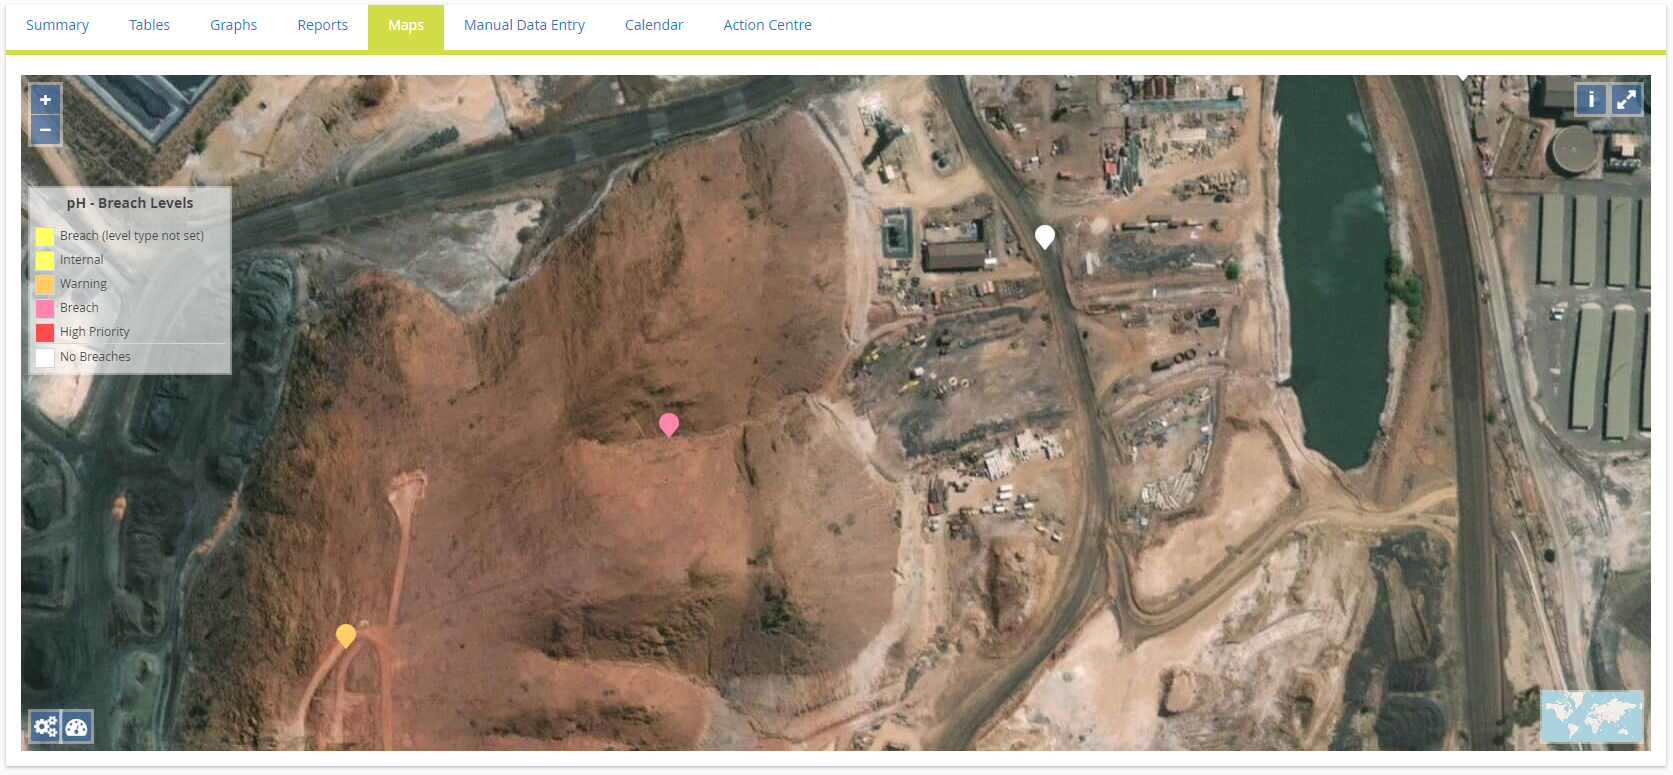
Breaches
Another option is to display where breaches are occurring. Within the Sample Point menu, choose the Breaches option. Then select the Variable you wish to view.
Breaches are highlighted based on the importance of their Threshold Level.
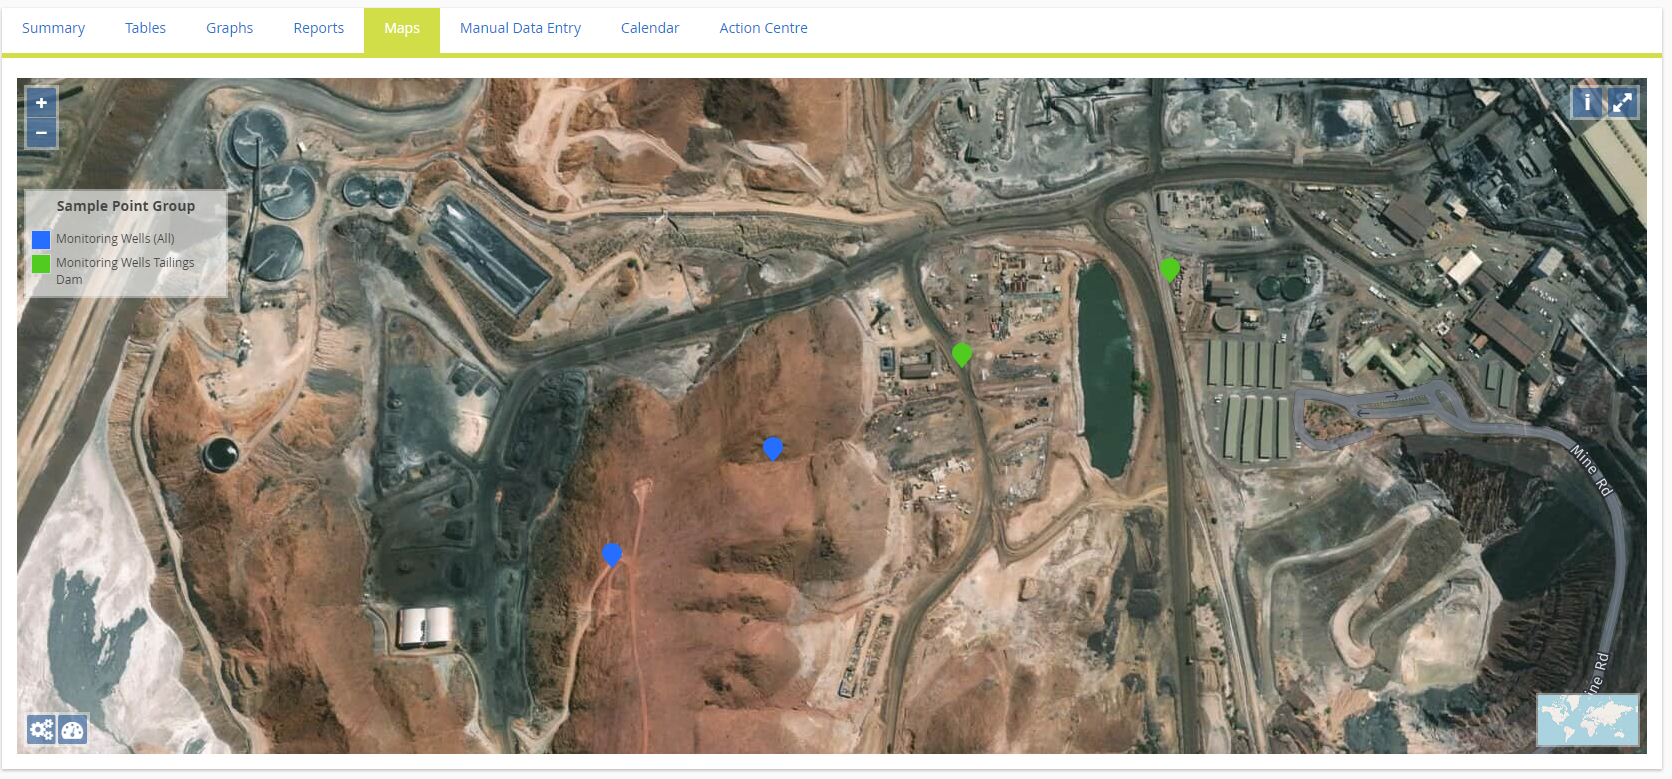
Sample Point Groups
To display which Sample Point Group each Sample Point is within, choose the Sample Point Group option from the Sample Point menu. This will then display which Sample Point Group each Sample Point is within. Those within multiple Sample Point Groups will display as a separate category.
Base Layers (non-geo-referenced)
Base layers can be added by clicking on the upload icon, (.png and .jpg). If no images are associated, click on Add. Then either choose an image or upload one.
The image will be placed in the middle of the extent of the Sample Points loaded.
You can check the boxes to move and resize the image. The images themselves do not need to have any type of coordinates embedded; the correct location is simply achieved by placing the image in the correct position for the map.
Use the mouse pointer to denote where to place the bottom left corner of the image and click. Repeat this until the image is correctly located. To size, follow the same process but click outside the top right of the image to increase the size. Once positioned and sized uncheck the tick boxes and Save.
The images are uploaded into the database and associated with the Dataset being used. Next time the mapping tab is selected using the same Dataset the previously uploaded images will load automatically. Any image uploaded can then be downloaded and associated with any Dataset.
The Opacity of each layer including the Base Layer and Sample Point Layer can be adjusted to suit. Each layer can also be independently turned on and off or via the group layer (applies to all uploaded images).
Secondary Coordinate System
There are secondary coordinate fields available to use in MonitorPro Desktop if the primary fields are set up to use other coordinate systems. By default, MonitorPro Web will use the secondary however this can be changed from the Administration page, by clicking the Advanced Database Settings.
Other articles in this section
MP-Web Output - Sentinel MappingMP-Web Output - Mapping Areas
MP-Web Output - Google Maps
MP-Web Output - Plotting Data